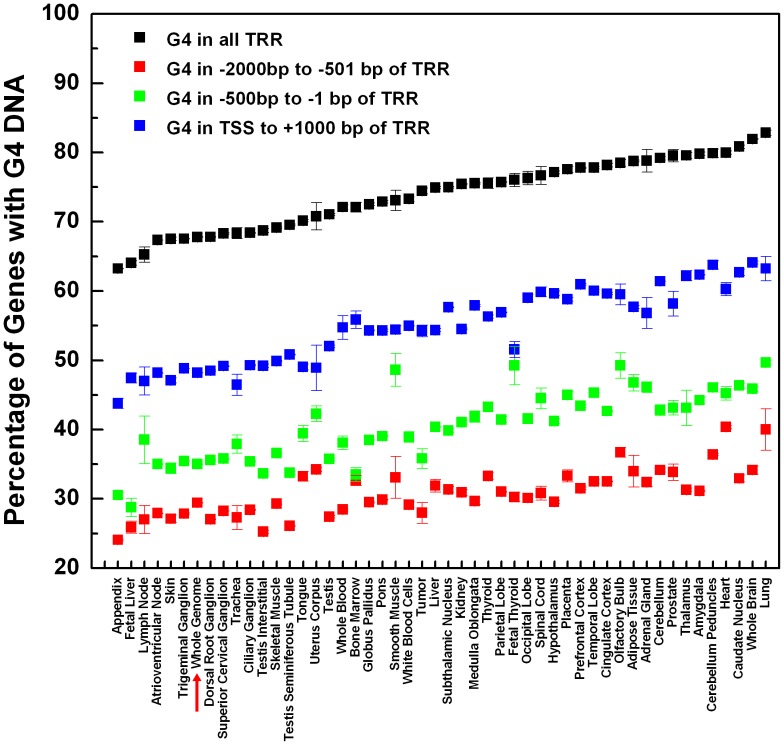
Figure 2. Enrichment of G4s in TRRs of genes active in different tissues.
The percentage of genes active in different tissues containing at least one G4-forming sequence in the whole TRR (black), −2,000∼−501 bp of TRR (red), −500∼−1 bp of TRR (green), and TSS∼+1,000 bp of TRR (blue). Enrichment of G4s in all protein-coding genes (G4 enrichment at genome level) is indicated by the red arrow. The calculation was repeated randomly for ten times (multiple transcripts of one gene were randomly chosen for ten times) to take into account the redundancy effects of multiple transcripts.

