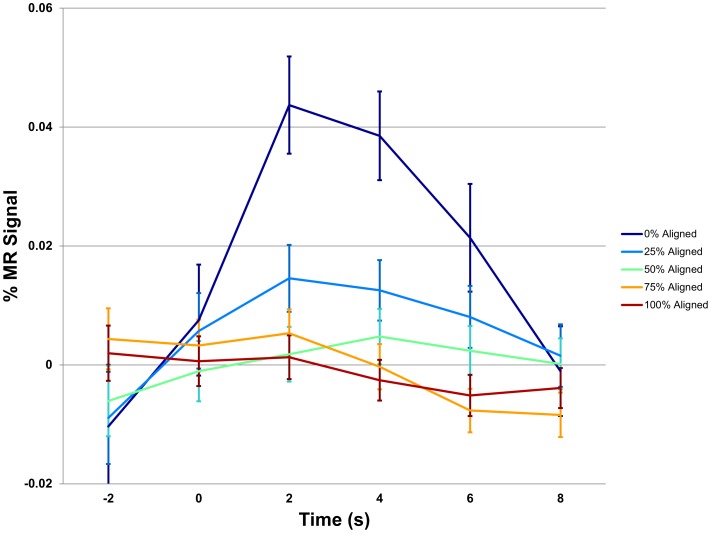
Figure 3. Bilateral insula exhibits graded response to group alignment.
After performing the statistical tests described in Figure 2, we examined the time course of the MR signal exhibited by the bilateral insula in the Choices condition. Time courses corresponding to each decision were categorized according to their group alignment values and plotted for the five levels of alignment. The average BOLD signal was highest for choices for which group alignment was lowest (ANOVA at t+4 seconds: p<10−4). Error bars represent standard error of the mean (SEM). Similar effects were observed for the other regions shown in Figure 2C (note that because participants' decisions were not systematically in register with the onset of image acquisition, linear interpolation was used to align the time-courses of the BOLD signal across decisions for averaging).

