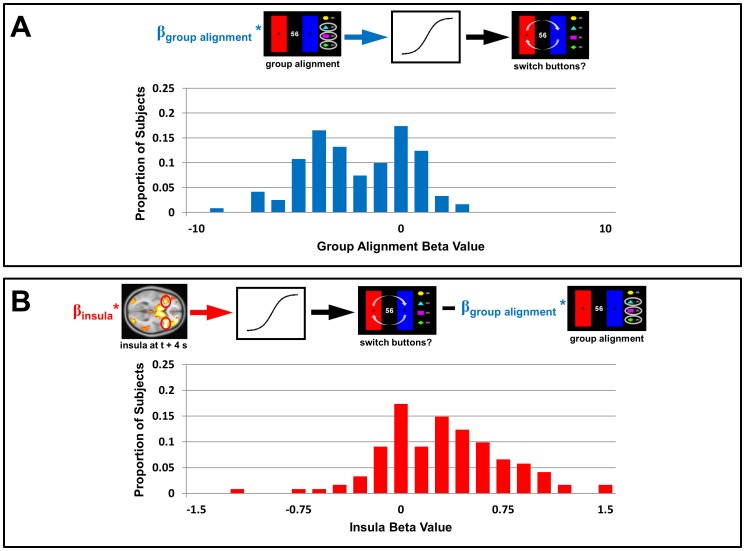
Figure 5. Hierarchical logistic regression of switching behavior in the Choices condition.
(A) Behavioral data alone. Using behavioral data from the Choices condition, the group alignment metric was used to predict when participants switched buttons. The beta values (n = 121 values, arbitrary units) for group alignment were significantly less than zero across participants (p<10−16), indicating that most participants consistently chose to switch when they were out of alignment with the group. (B) Behavioral data and insula activity. Insula activity for each choice (at time t+4 seconds, where t is the time at which a decision was submitted) was incorporated into the regression model, to test the degree to which this explained switching behavior beyond that explained by group alignment alone. The beta values (n = 121 values, arbitrary units) for insula activity were significantly greater than zero across participants (p<10−11), indicating that for most participants increased insula activity was associated with a greater probability of switching, independent of information about group alignment.

