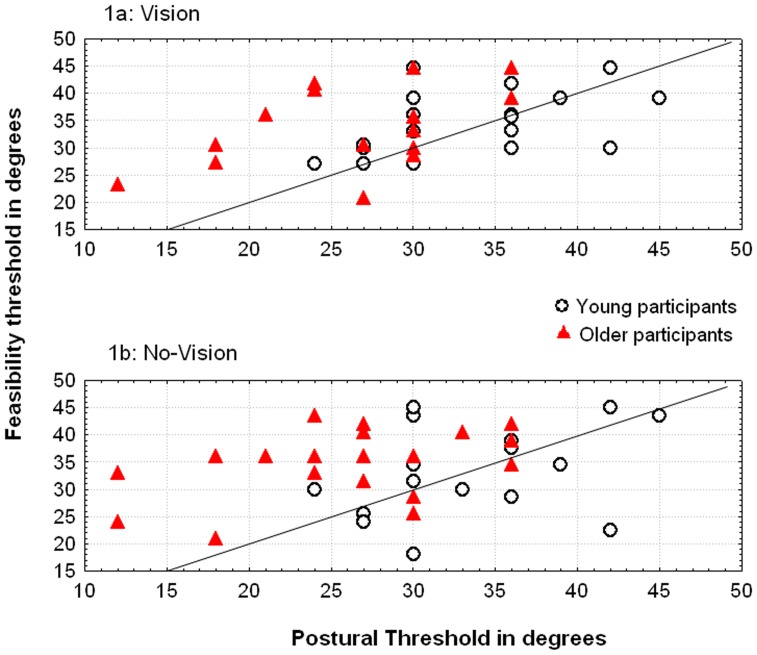
Figure 1. Individual results.
Self-estimated ability (y-axis; feasibility thresholds in degrees) and actual ability (x-axis; postural thresholds in degrees) as a function of age and the vision-enabled and haptic conditions. The diagonal line represents a perfect fit between self-estimated and actual ability; values below the diagonal correspond to underestimation of ability and values above the diagonal correspond to overestimation. NB: although the scatter plots of the young adult and older groups show similar values on the y-axis (self-estimated ability), the plot for the older group is shifted to the left on the x-axis (i.e. lower actual ability).

