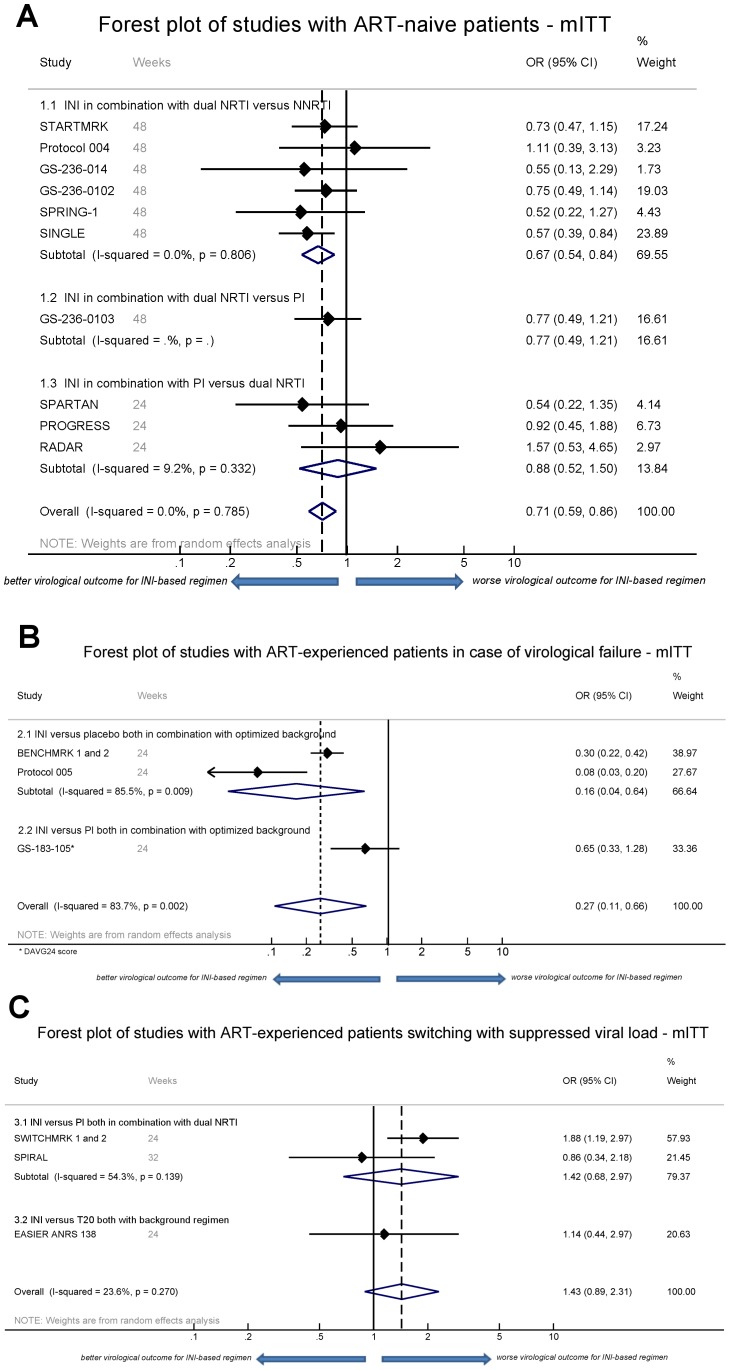
Figure 3. Forest Plot of mITT meta-analyses.
Panel A: Forest plot showing the meta-analysis of mITT data extracted from studies with therapy-naïve patients. Besides an overall analysis, three sub-analyses for three different comparisons are depicted. The black line indicates OR = 1, signifying no benefit of the INI arm compared to the non-INI arm. The dotted line shows the odds ratio of all included studies. The individual odds ratios as well as the proportionate weight in the overall analysis are shown in the right column. Panel B: Forest plot showing the meta-analysis of mITT data extracted from studies with ART-experienced patients in case of virological failure. Panel C: Forest plot showing the meta-analysis of mITT data extracted from studies with ART-experienced patients switching with suppressed viral load. mITT = modified intention-to-treat; ART = antiretroviral treatment; INI = integrase inhibitor; (N)NRTI = (non-)nucleoside reverse transcriptase inhibitor; PI = protease inhibitor; T20 = enfuvirtide: OR = odds ratio.

