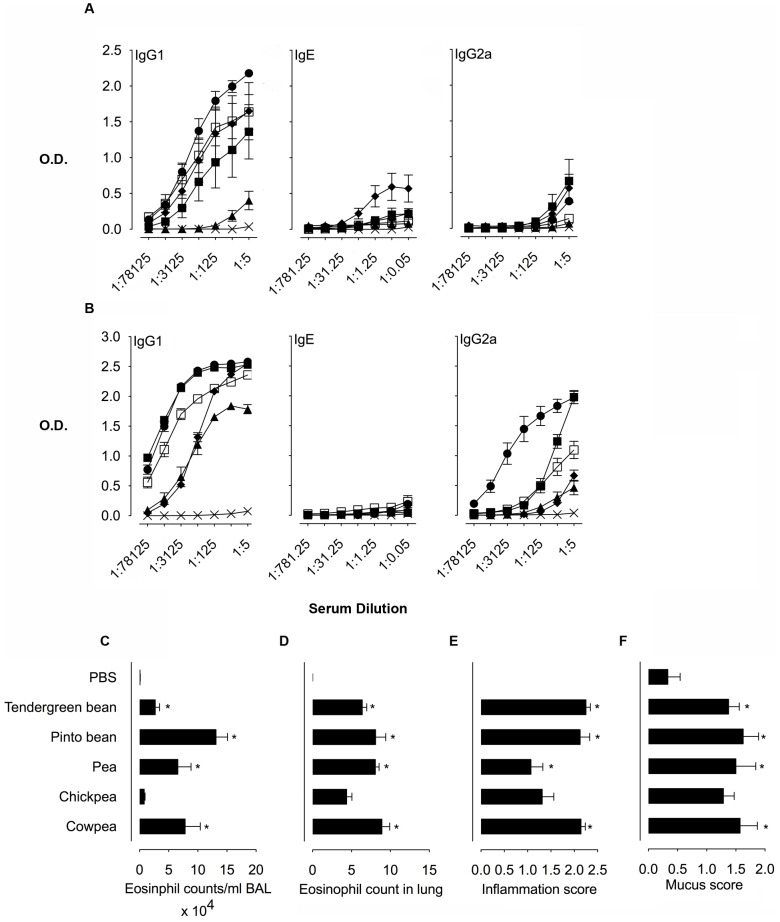
Figure 2. Immune responses to αAIs upon intranasal and intraperitoneal immunization.
Serum antibody titres for Anti-αAI IgG1, IgE and IgG2a from A. i.p. αAI immunized mice and B. from i.n. αAI immunized mice. The treatment groups for A and B include PBS only ×, purified αAI proteins from Tendergreen bean ▪, Pinto bean □, pea ▴, chickpea ⧫, and cowpea •. Data are expressed as mean OD450 nm ± SEM; n = 8, duplicate samples. For IgE, dilutions are expressed ×103. C. Eosinophil counts in BAL fluid from mice immunized with i.n. αAIs. D. Eosinophil counts in Luna-stained lung sections from mice immunized with i.n. αAIs. E. Inflammation scores of lung sections from mice immunized with i.n. αAIs. F. Mucus scores in PAS-stained lung sections from mice immunized with i.n. αAIs. Data are expressed as means ± SEM; n = 8. For eosinophil counts in BAL and lungs, data were compared using the Kruskal-Wallis test followed by Dunn's multiple comparison test. For histological scoring, data were compared with the Mann Whitney test. *p<0.05 for all groups above the PBS controls. These are representative data from 2 experiments.

