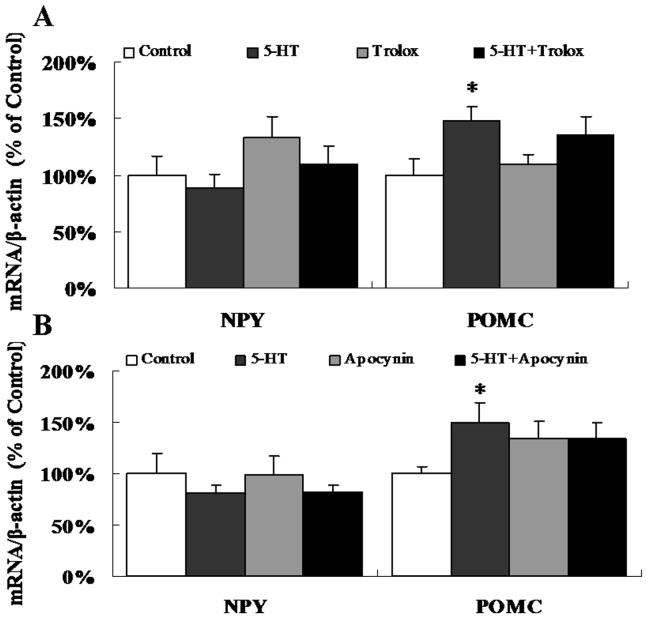
Figure 5. 5-HT-induced NPY and POMC mRNA expression.
Real-time quantitative PCR was used to examine the mRNA expression of NPY and POMC. (A) ICV co-injection with 5-HT and Trolox. n = 11–12 per group. (B) ICV co-injection with 5-HT and Apocynin. n = 8–9 per group. Data are expressed as the means ± SEM. *, 0.01<p<0.05, vs. the control.

