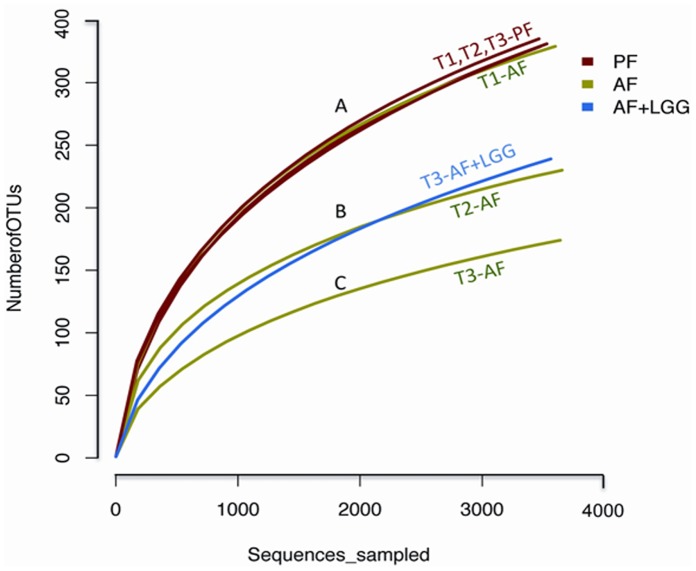
Figure 1. Rarefaction curves indicating the observed number of operational taxonomic units (OTUs) within a sample.
Rarefaction curves of OTUs clustered and saturated at different level across exposure groups and indicate the intra-sample diversity. While the baseline PF and AF OTUs cluster together with the PF T2 (end of week 6) and PF T3 (end of week 8) groups (A), the AF T2 and LGG groups (B) saturate earlier than the baseline group show they are less diverse than the baseline group. The AF T3 exposure group (C) saturates the earliest, indicating it is the least diverse sample.

