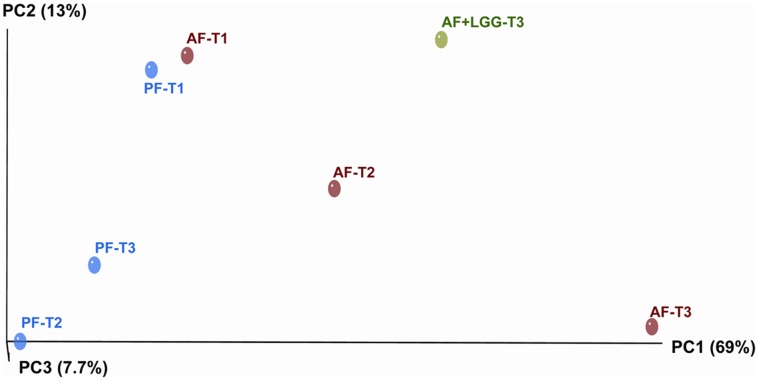
Figure 3. Weighted PCoA of bacterial genus by time and exposure group using UniFrac distance matrix.
This dimension reduction analysis demonstrates the clustering of samples based on their location and similar microbial profiles. The first component explains 69% and the second component explains 13% of the variance in the samples. AF T3 group is the most divergent of the exposure groups while AF T2 and AF+LGG T3 are separated from the other baseline samples as well. AF T1, PF T1 are most similar as are PF T2 and T3.

