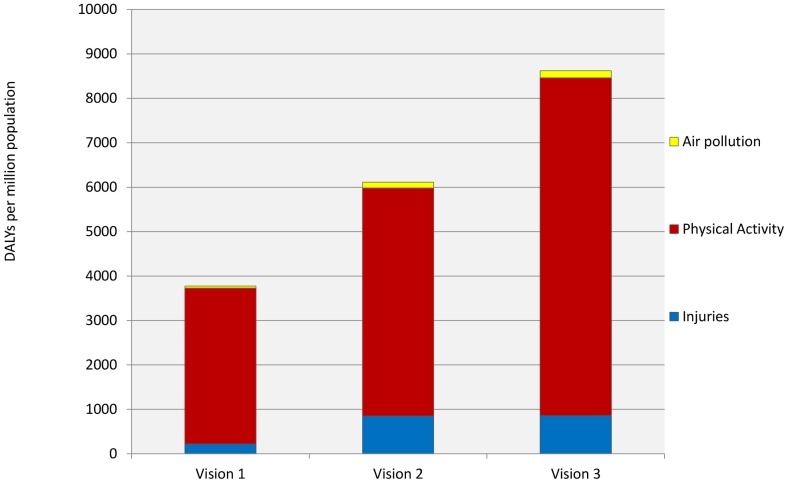
Figure 3. Health gains by Vision and risk factor.
Disability Adjusted Life Years gained per million population under each of the three visions, broken down into the proportions attributable to improvements from air quality, increased physical activity and decreased road injuries. See Table 7 for full results.

