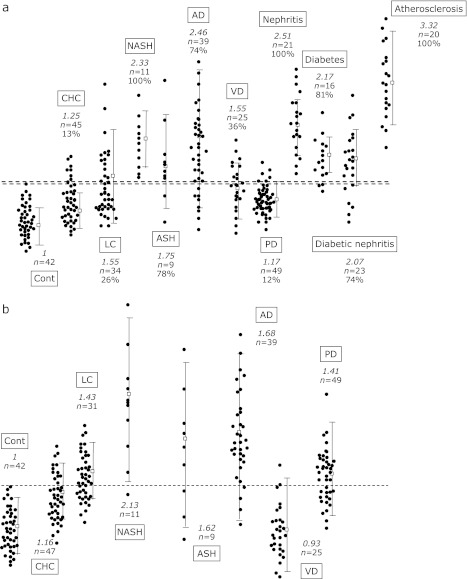
Fig. 4.
Relative levels of hydroperoxyoctadecadienoic acid in the plasma (a) and erythrocytes (b) of patients compared to healthy volunteers (Cont). The italic number in the figure show the average level compared to Cont and the number studied is shown as ”n=” individually. Percentages shown in the figure are the number above the highest level of Cont. CHC, chronic hepatitis C; LC, liver cirrhosis; NASH, non-alcoholic steatohepatitis; ASH, alcoholic steatohepatitis; AD, Alzheimer’s disease; VD, vascular disease; and PD, Parkinson’s disease.

