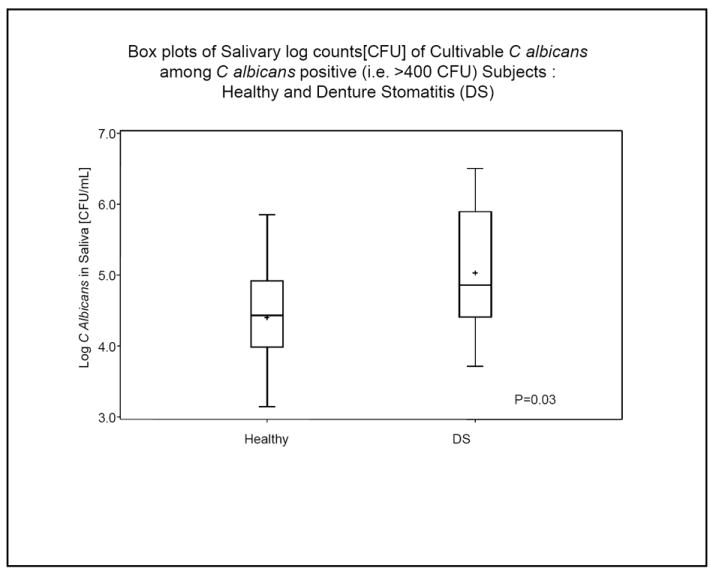
Figure 3.

Mean log C. albicans counts in saliva among DS and control participants. The boxplot indicates the log CFU C albicans / mL of saliva. The plot shows median, upper, and lower 25th percentile range (box boundaries) and range as outer markings. The plus sign shows the mean log values.
