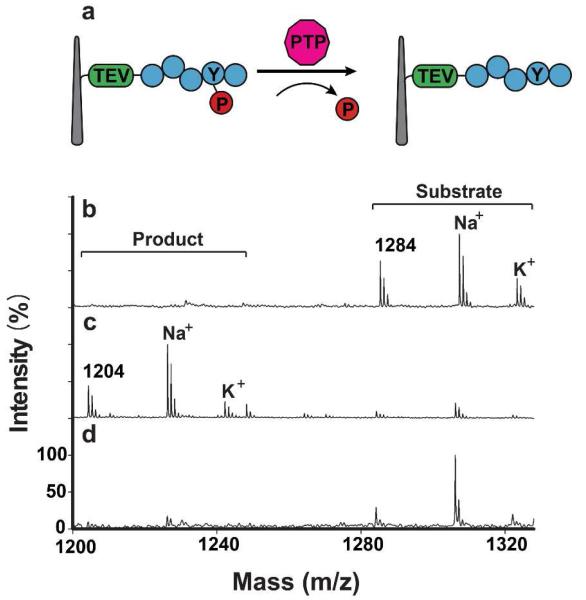
Figure 3.
(a) Schematic for a PTP activity assay using a NW-cell sandwich assembly. (b-d) MALDI-TOF spectra for: (b) substrate peptides cleaved by TEV; (c) peptides cleaved from NWs by TEV after an hour of sandwich assembly with immobilized HeLa cells; and, (d) peptides cleaved by TEV after an hour-long sandwich assay with the inclusion of the PTP inhibitors, α-bromo-4-hydroxyacetophenone (80 μM) and sodium orthovanadate (200 μM). Substrate and product peptides show three distinct mass peaks including two adducts (Na+ and K+), respectively.

