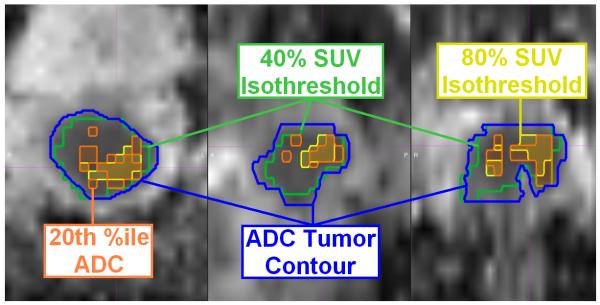
Figure 3.
Example of imaging concordance between FDG-PET and ADC-MRI for one patient on axial (left), sagittal (center), and coronal (right) sections. The ADC map (blue) and FDG-PET (green) tumor contours are shown, with overlap observed between the 80% FDG-PET SUV isothreshold (yellow) and the 20th percentile ADC value (orange), indicative of the tumor subvolume with the most restricted diffusion, on the ADC map.

