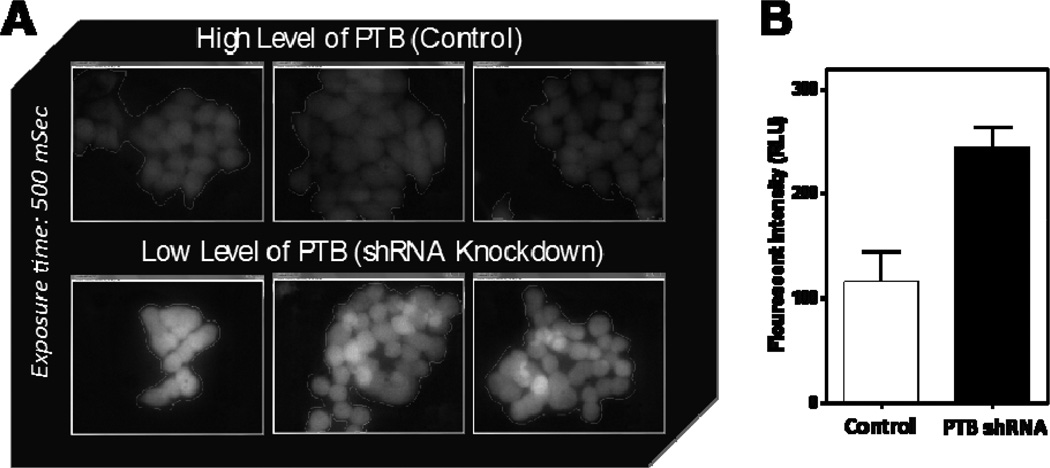
Figure 4.
Quantitation of FL intensity change in engineered cells after PTB KD. A. Acquired FL images were analyzed with NIH ImageJ software. All images were acquired on gray scale channel for a better dynamic range. Exposure time was set to 500 mSec for all the images. B. Measured FL intensity difference was >2-fold between control and PTB shRNA treated samples.

