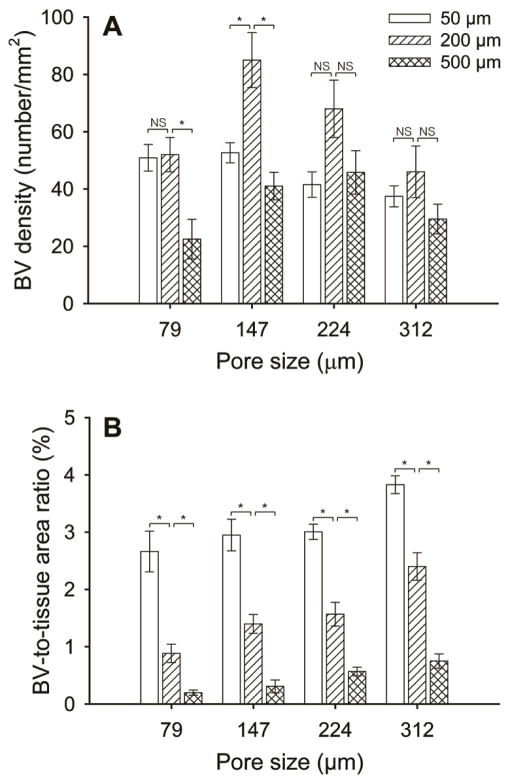
Figure 7.
Plots of (A) blood vessel density, and (B) blood vessel-to-tissue area ratio as quantified from histology analyses. Data were presented as mean ± standard deviation (n = 4). * indicates significant difference between two groups (p<0.005), whereas NS means not statistically significant (p>0.005). For each sample, at least 200 blood vessels from 8 tissue sections were examined.

