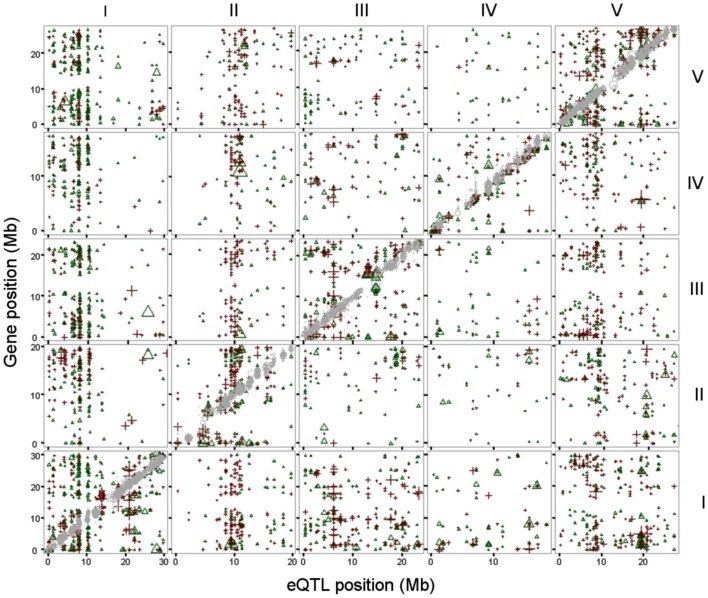
Figure 1.
eQTLs, physical position of the top of the eQTL (x-axis) plotted against the physical position of the gene (y axis). Both physical positions are in mega basepairs (Mb) and plotted per chromosome (I-V, indicated at the top and right side). eQTLs for local (cis) regulation are in gray (diagonal). eQTLs with a Ler positive effect are depicted as green triangles, eQTLs with a Cvi positive (=Ler negative) effect as red plus signs. Chromosomes are indicated on the right for rows and on top for columns of graphs.

