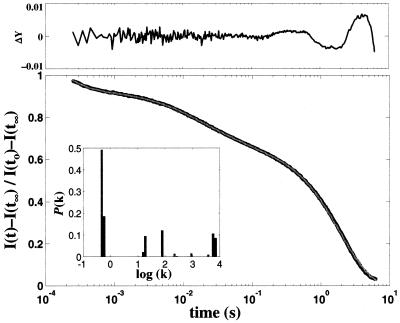
Figure 3.
Normalized folding kinetics (observed at 440 nm, black line) fit to 80 rate constants spanning logarithmically 105 to 10−2 s−1 (gray line) by using a non-negative least-squares algorithm. (Upper) Residuals from the fit. (Inset) The projected population of rate constants [7.0 × 10³ s−1 (8%); 5.7 × 10³ (9%); 9.2 × 10² (1%); 2.2 × 10² (1%); 7.9 × 101 (11%); 1.9 × 101 (9%); 1.5 × 101 (2%); 5.9 × 10⁻¹ (16%); 4.8 × 10⁻¹ (43%)].

