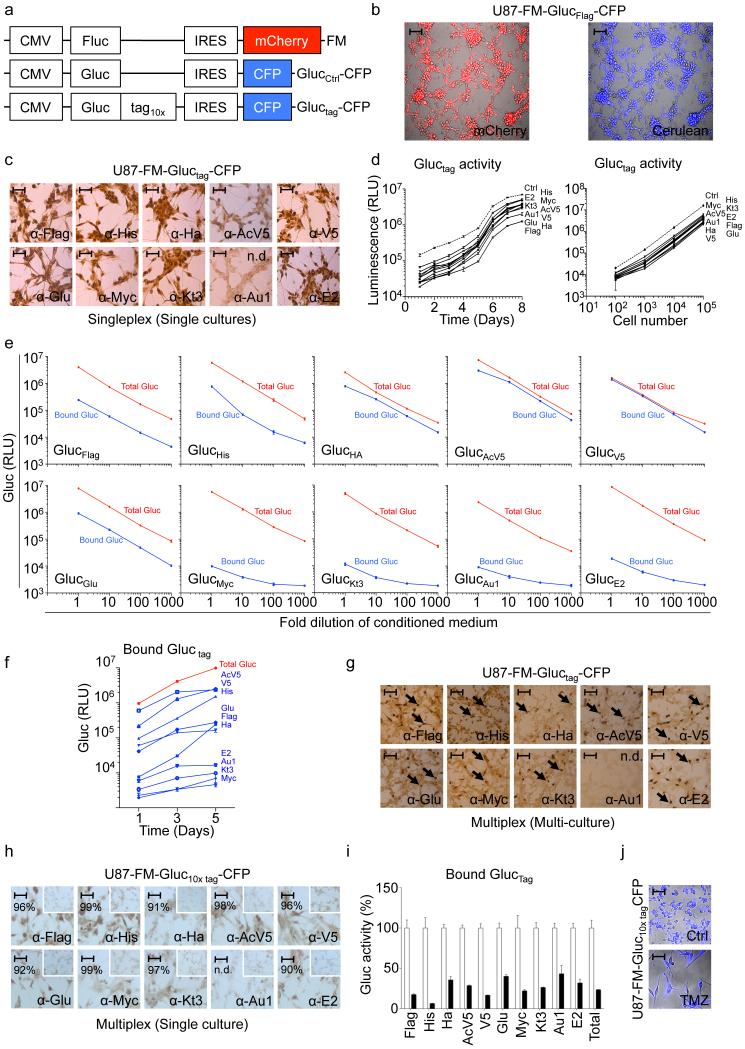
Figure 1. Gluctag multiplex assay development and validation in vitro.
(a) Schematic of the lentiviral vector constructs encoding the luciferase reporters. (b) Fluorescence microscopy analysis of a representative U87-FM-Gluctag-CFP cells (using GlucFlag reporter) showing mCherry levels (in red; marker for tumor cells) and CFP expression (in blue; marker for transduction efficiency). (c) Immunostaining against the various tags in U87-FM cells expressing different Gluctag. (d) Gluc activity in U87 cells expressing different Gluctag with respect to cell proliferation over time and cell number. The dashed line represents GlucCtrl activity. (e) Gluctag immunobinding assay versus total Gluc activity using serial dilutions of the conditioned medium from a 1-day culture of U87-FM cell lines expressing the individual Gluctag reporters. (f-g) Equal mixture of ten cell lines each expressing a different Gluctag reporter. (f) Immunobinding assay of Gluctag from a mixed population. (g) Immunostaining for the ten different tags expression in the mixed population of U87-FM cell culture. (h-i) U87-FM cells expressing all ten different Gluctag reporters. (h) Immunostaining for the ten different tags in one cell line. The insert panels show staining of control parental cells. Percentages of positively stained cells are indicated. (i) Immunobinding assay of all ten Gluctag reporters in one cell line after TMZ treatment (black bars) compared to untreated control (white bars). (j) CFP fluorescence microscopy of cells in (h–i) with or without 600 μM TMZ. Size bar (in b,c, g and h) = 200 μm. Size bar (i) = 400 μm. N.d. = not detectable.

