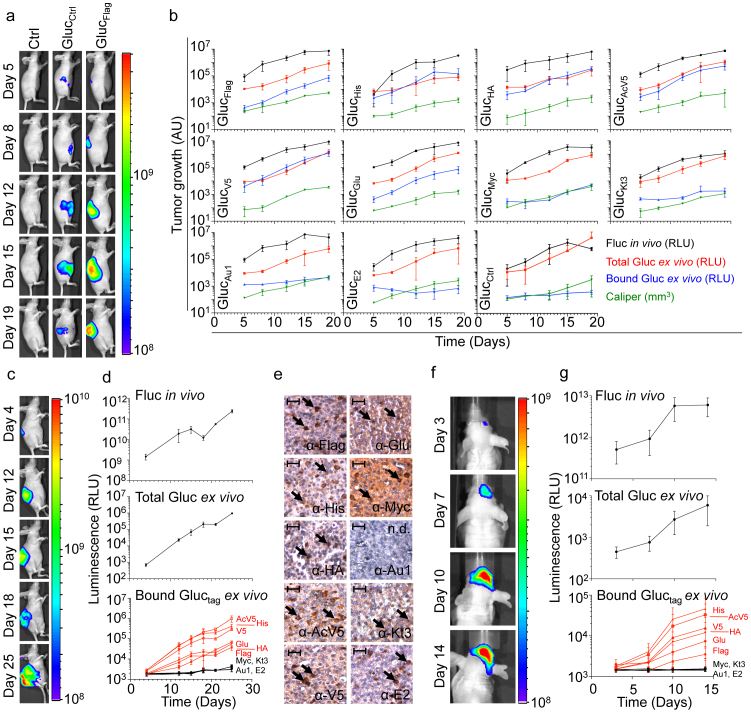
Figure 2. Gluctag multiplex assay in vivo.
(a) U87-FM cells expressing different Gluctag were implanted subcutaneously in nude mice (n = 3) and tumor growth was monitored overtime. Shown are representative Fluc bioluminescence images of the U87-FM-Gluctag-CFP tumors expressing the GlucFlag reporter. (b), Quantitation of the different U87-FM tumors expressing different Gluctag reporters; Fluc activity (black), calliper measurement (green), total Gluctag activity in the blood (red), and bound Gluctag activity after immunobinding (blue). (c–d) U87-FM cells expressing the different Gluctag reporters were mixed in equal amounts and injected subcutaneously in the same mouse (n = 5). Tumor growth was monitored using Fluc imaging and total Gluc blood assay as in (a–b). Individual cells subpopulation within the same tumor were monitored using the multiplex Gluctag immunobinding assay. (e) Immunostaining for the ten different tags expression in the mixed U87-FM-Gluctag-CFP tumor. Black arrows indicate positive staining for cells expressing the corresponding Gluctag. Size bar = 200 μm. N.d. = not detectable. (f–g) Mixed population of U87-FM cells expressing all ten different tags were implanted intracranially in the brain of nude mice (n = 5). Tumor growth was monitored with Fluc imaging and Gluc total blood assay, and different tumor cell subpopulations were monitored using the multiplex Gluctag assay as in (c–d). Fluc bioluminescence imaging of a representative mouse is shown in (f). Data shown in (b,d, and g) as average relative light units (RLU) ± standard deviation. Heatscales in (a, c and f) indicate relative photon levels (photons/sec) as measured by the CCD camera.

