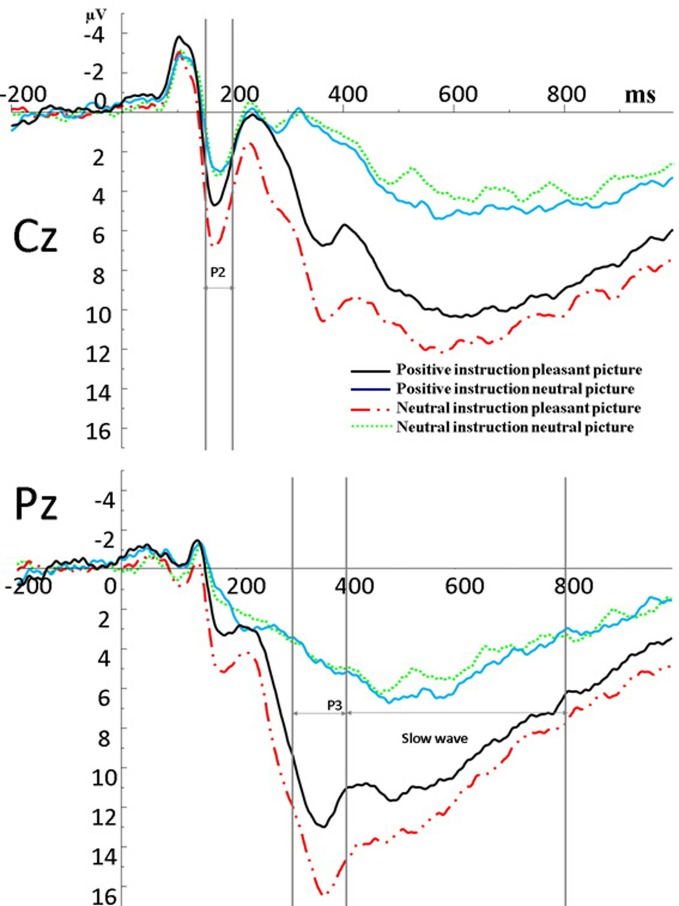
Figure 3.
Stimulus-locked ERPs at Cz and Pz for the four conditions. The vertical lines at Cz indicate the time windows (150–200 ms) submitted to statistical analysis of the P2 component. The vertical lines at Pz indicate the time windows (330–400 and 400–800 ms) submitted to statistical analysis of the P3 and Slow wave components.

