
Fig. 3.
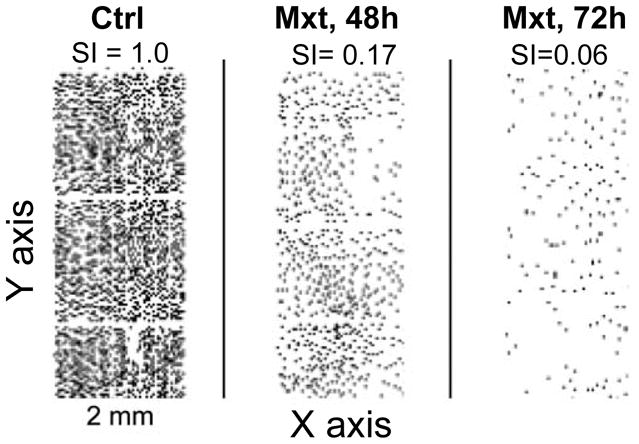
Decreased cell saturation density at confluence as another marker (senescence index, SI) reflecting “depth” of cell senescence.
The A6549 cells were untreated (Ctrl) or grown in the presence of 2 nM Mxt for 48 or 72 h in chamber slide-cultures. The cells were fixed and stained with DAPI as described in the protocol. Their presence and location on the slides concurrently with other parameters (measured as shown in Fig 2) was recorded by LSC (25,27–29). The observed decrease in cell density in the Mxt-treated cultures is presented as a fraction (senescence index, SI) of cell density in the untreated exponentially growing culture (SI = 1.00).