Figure 5.

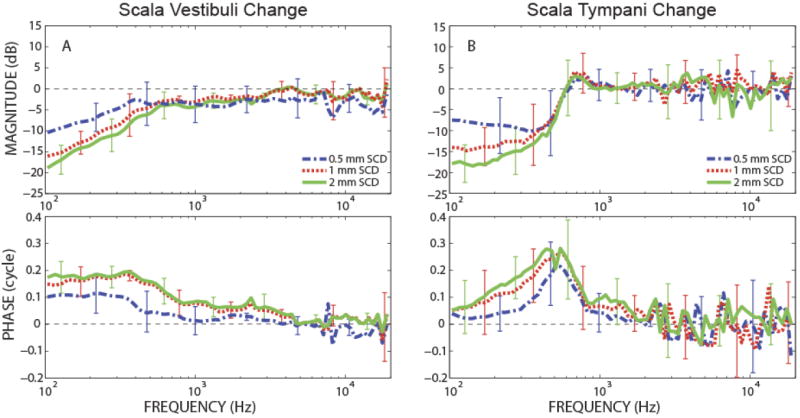
Changes in scala pressures due to various sizes of SCD, represented with geometric mean and standard deviation (error bars) for magnitudes and linear mean and deviations for phase. (A) Change in PSV (N=5), (B) Change in PST (N=6).

Changes in scala pressures due to various sizes of SCD, represented with geometric mean and standard deviation (error bars) for magnitudes and linear mean and deviations for phase. (A) Change in PSV (N=5), (B) Change in PST (N=6).