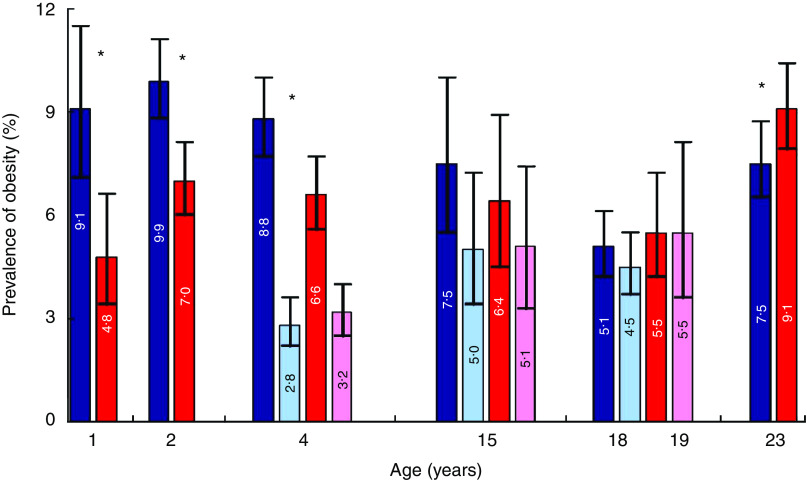
Fig. 1.
(colour online) Prevalence of obesity by age according to criteria of WHO(
17
,
18
) (
 , males;
 , females) and Cole et al.(
7
) (
 , males;
 , females). Pelotas, southern Brazil, 1982 to 2004–2005. Values are means with standard deviations represented by vertical bars. *Mean obesity prevalence was significantly different between males and females (χ
2 test): P < 0·05

