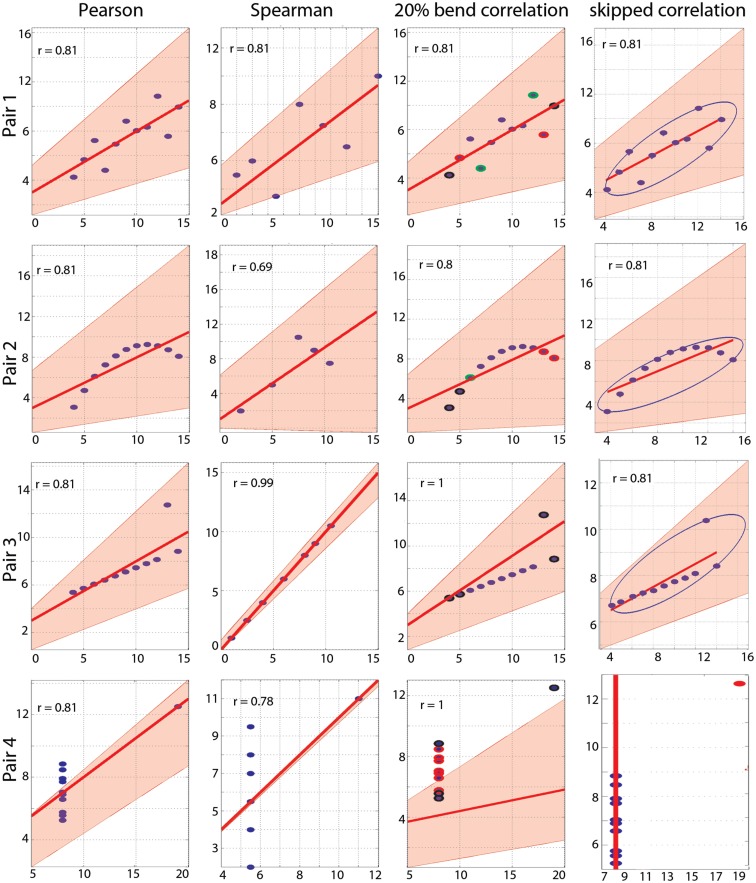
Figure 2.
Correlation results. From left to right are illustrated Pearson’s, Spearman’s, 20% bend, and Pearson’s skipped-correlations with the 95% bootstrapped CIs as pink shaded areas. The scale for Spearman’s correlations differs from the others because ranked data are plotted. For the 20% bend correlation, red indicates data bent in X, green in Y and black in both. No skipped correlation is returned for pair 4.

