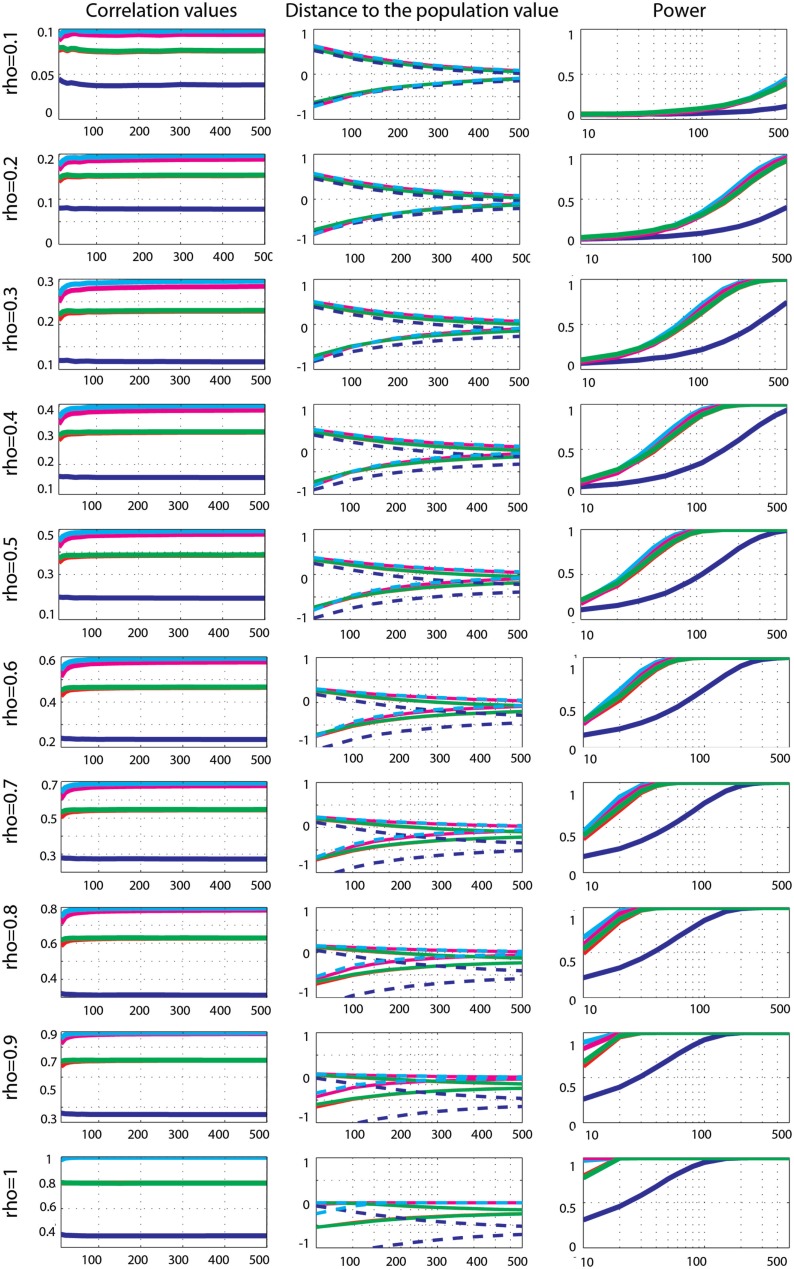
Figure 6.
Effect sizes and power for Gaussian data contaminated by 10% of marginal outliers. From left to right are displayed: the mean correlation values; the 99.99% CIs (i.e., corrected for the 14 sample sizes) of the distance to the correlation in the simulated Gaussian population contaminated by univariate outliers; the power for Pearson’s (blue), skipped Pearson’s (cyan), Spearman’s (red), skipped Spearman’s (magenta), and 20% bend (green) correlations for each effect size (from top r = 0.1 to bottom r = 1). In column one, the scales of the mean correlation values differ.

