Table 1.
The biological results for sulfonamide analogs 7-1 to 7-46.
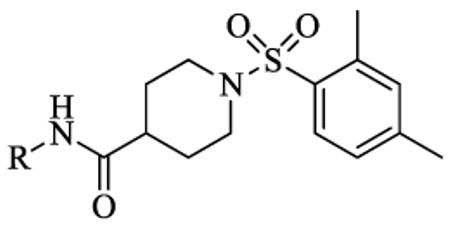
| |||||
|---|---|---|---|---|---|
| Compound | R | IC50a,b(nM) | Compound | R | IC50(nM) |
| 7-1 |

|
18 | 7-24 |

|
4.6 |
| 7-2 |
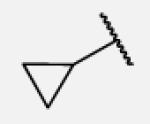
|
6900 | 7-25 |

|
29 |
| 7-3 |

|
5.2 | 7-26 |
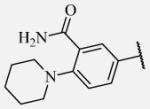
|
102 |
| 7-4 |

|
263 | 7-27 |

|
41 |
| 7-5 |
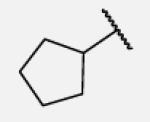
|
5.8 | 7-28 |

|
2.8 |
| 7-6 |
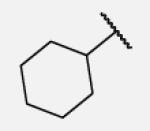
|
1.7 | 7-29 |

|
6.9 |
| 7-7 |
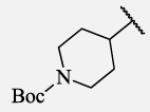
|
1.1 | 7-30 |
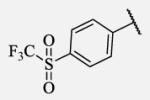
|
8.7 |
| 7-8 |
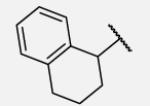
|
0.6 | 7-31 |

|
20 |
| 7-9 |
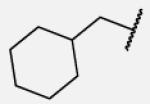
|
1.2 | 7-32 |
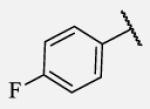
|
25 |
| 7-10 |
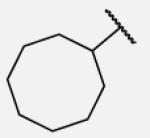
|
0.4 | 7-33 |

|
20 |
| 7-11 |
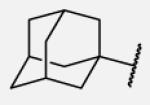
|
8.5 | 7-34 |

|
17 |
| 7-12 |
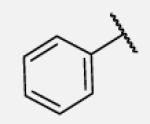
|
23 | 7-35 |
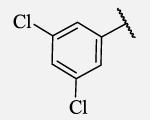
|
12 |
| 7-13 |
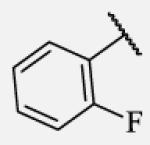
|
20 | 7-36 |

|
43 |
| 7-14 |
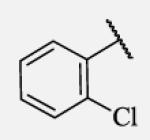
|
250 | 7-37 |
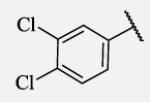
|
6.7 |
| 7-15 |
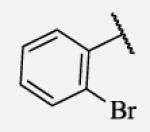
|
30 | 7-38 |

|
1.6 |
| 7-16 |
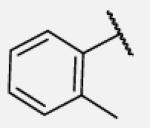
|
640 | 7-39 |
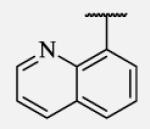
|
290 |
| 7-17 |
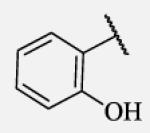
|
2200 | 7-40 |

|
45 |
| 7-18 |

|
25 | 7-41 |

|
78 |
| 7-19 |

|
55 | 7-42 |
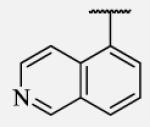
|
8.3 |
| 7-20 |

|
6.0 | 7-43 |

|
2.3 |
| 7-21 |

|
13 | 7-44 |

|
23 |
| 7-22 |

|
110 | 7-45 |

|
0.6 |
| 7-23 |

|
5.2 | 7-46 |
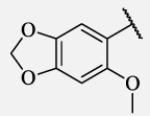
|
30000 |
Reported IC50 values are the average of three replicates. The fluorescent assay as performed here has a standard error between 10 and 20% suggesting that differences of two fold or greater are significant.
t-AUCB that has an IC50 between 1 and 2 nM was used as positive control.
