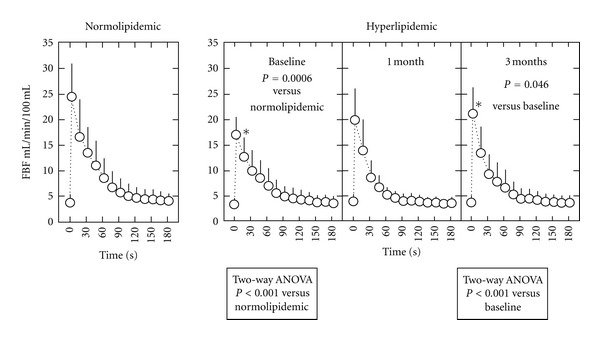
Figure 1.

Left panel. Forearm blood flow (FBF) during reactive hyperemia in normolipidemic subjects (n = 18). Right panel. Effects of EPA on FBF during reactive hyperemia in hyperlipidemic subjects (n = 16). The P values for curve difference determined by 2-way ANOVA are shown. Data represent the mean ± SD. *P < 0.05 versus normolipidemic subjects and † P < 0.05 versus baseline.
