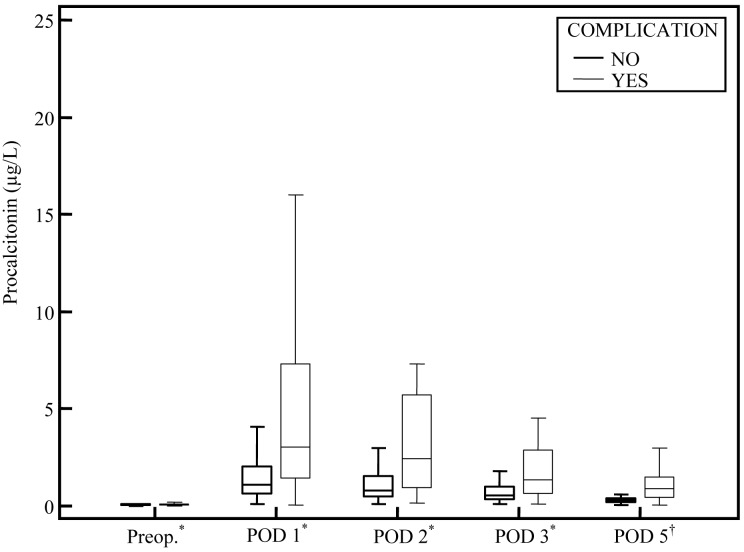
Figure 2.
Perioperative procalcitonin (PCT) concentrations in patients with and without complications after colorectal surgery. The box represents 25th-75th percentiles and line within the box is the median value. P = 0.003 on postoperative day (POD) 1, P ≤ 0.001 on PODs 2-5 (Mann-Whitney test). Asterisk indicates the group without complications n = 49; group with complications n = 29. Dagger indicates the group without complications n = 37; group with complications n = 21.

