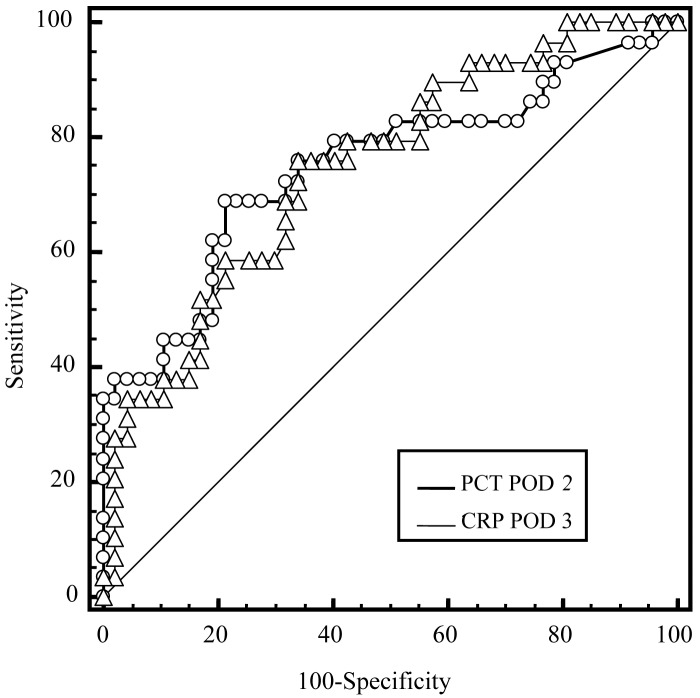
Figure 3.
Diagnostic accuracy of early postoperative (postoperative day [POD] 1-3) C-reactive protein (CRP) and procalcitonin (PCT) concentrations with regard to infectious complications expressed by the receiver operating characteristic (ROC) curves. Comparison of ROC curves with the largest area under the curve for each biomarker on PODs 1-3 shows similar diagnostic accuracy of CRP on POD 3 and PCT on POD 2 with the area under the curve of 0.746 and 0.750, respectively.

