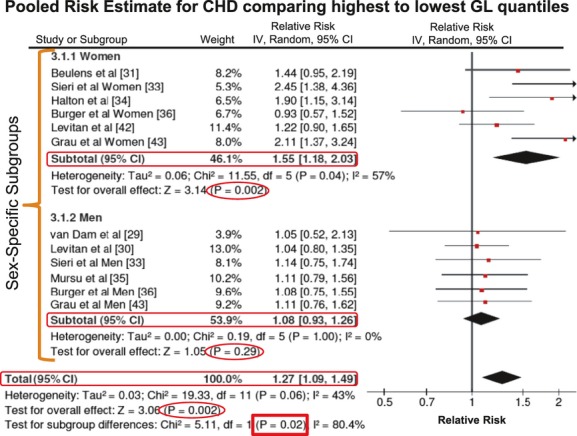
Figure 3.

Pooled risk estimate of all prospective cohorts investigating the association of highest GL exposure with CHD events (including death and myocardial infarctions) relative to the reference exposure (ΔGL between mean of highest exposure and mean of reference=89.4±9.5 SE). The figure is stratified by sex-specific subgroups with subtotal boxes in 3.1.1 and 3.1.2 summarizing the pooled analysis for women31,33,34,36,42,43 and for men,29,30,33,35,43 respectively. The total analysis box represents the overall pooled analysis for both men and women. P values in circles are based on generic inverse variance (IV) methods in random-effects models and represent the significance for association of high-GL diets with CHD. The P value in a rectangle depicts the significance of differences between the subgroups. Interstudy heterogeneity was tested by Cochrane's Q (χ2) at a significance level of P<0.10 and quantified by I2.38 CHD indicates coronary heart disease; GI, glycemic index.
