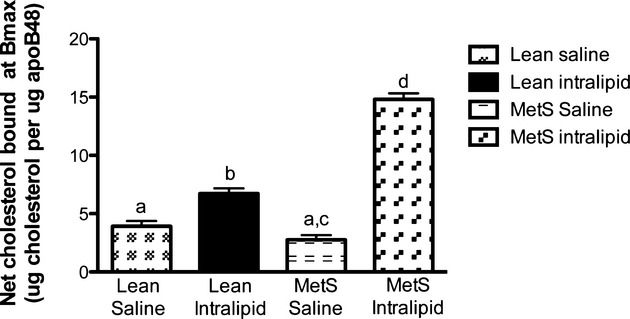
Figure 6.

Net cholesterol bound to biglycan (associated with native TRL) at Bmax as assessed from the solid-phase binding assay. Native TRL were isolated after intragastric saline and glucose (4%) infusion (fasted state) or intragastric intralipid (20%) and glucose (4%) infusion (fed state) in the lean and MetS JCR:LA-cp rats. Bmax values (maximal binding capacity) were calculated from a solid-phase binding assay, which was standardized to a range of apoB48 concentrations to allow for generation of KD and Bmax values. For Bmax values, see Table 3. Net cholesterol bound was calculated as the product of the Bmax value for the respective TRL fraction and its cholesterol concentration. Different letter subscripts (a through d) all indicate a significant difference of P<0.05 between the groups according to 1-way ANOVA (n=3). MetS indicates metabolic syndrome. Values with the same letter subscript are not statistically different.
