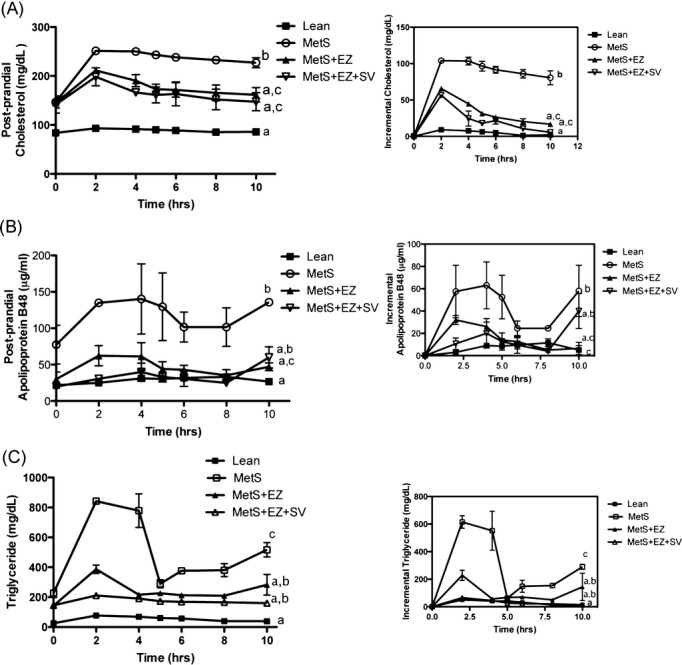
Figure 9.

Postprandial (nonfasting) (area under the curve) plasma response for (A) cholesterol, (B) apoB48, and (C) triglyceride after an oral fat challenge (n=4) for lean, MetS, and MetS rats treated with ezetimibe (EZ) alone and in combination with simvastatin (SV). Different letter subscripts (a through c) all indicate a significant difference of P<0.05 between the groups according to 1-way ANOVA. MetS indicates metabolic syndrome. Values with the same letter subscript are not statistically different.
