
Figure 2.
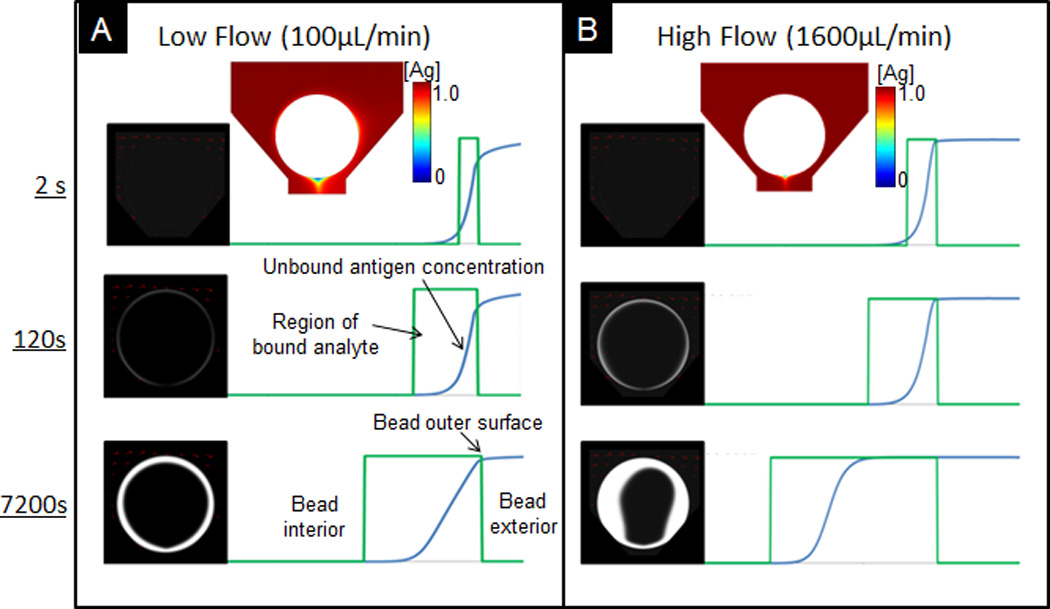
Comparison of spatial and temporal distribution of captured analytes under low (A) and high (B) flow rate. To the right, region of bound analyte and distribution of unbound analytes. Boxed regions (green) depict the width of the reaction front and the blue curves show the distributions of unbound antigen in bead. Cross sectional plots above figures show distribution of free antigen at the exterior of the bead.