
Figure 3.
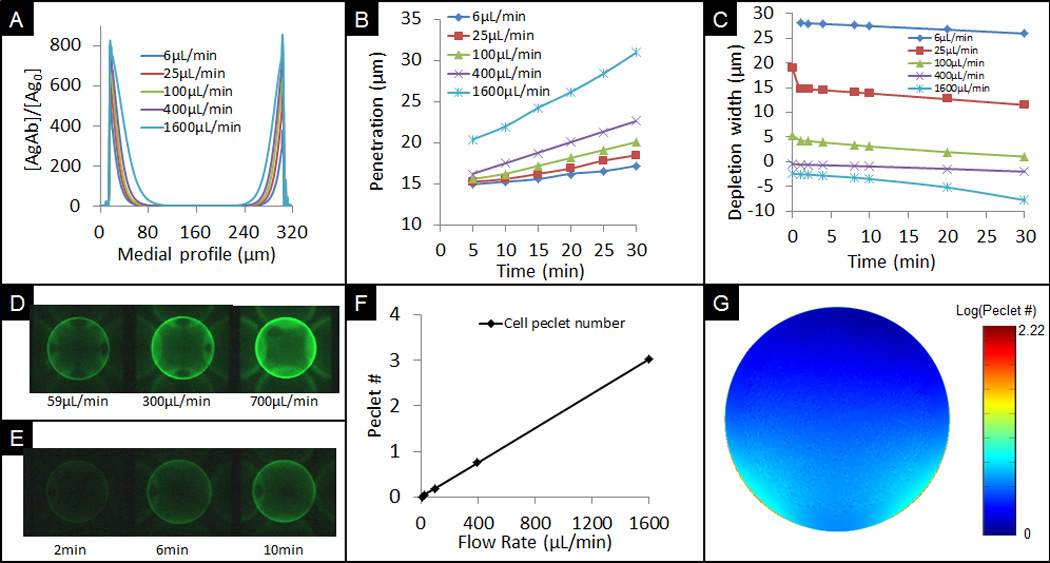
A) Profile of captured CRP antigen cross medial slice of bead derived from computational simulations for different flow rates. B) Progression of penetration depth of bound analytes under different flow rates based on models. C) Calculated depletion width outside the bead at different simulated times for various flow rates. Negative values signify the interior of the bead. D) Experimental data showing different signals at a low, medium, and high flow rate after 10min delivery. E) Experimental data showing signal development over time at 100µL/min flow rate and 100ng/mL concentration. F) Comparison of cell Péclet number for various flow rates. G) Cross sectional xz-view of bead showing distribution of Péclet number on the bead.