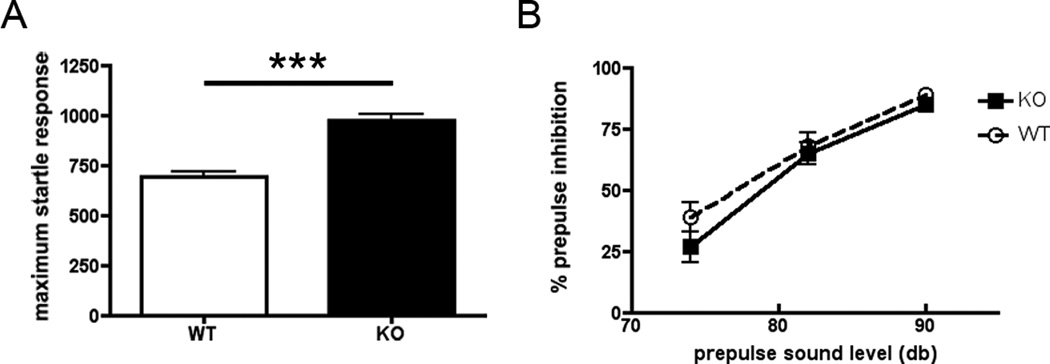
Figure 1.
(A) Acoustic startle response to 120 db stimulus. Data are the average (±SEM) for wild type (WT), n=13 (white bar) and knockout cGKII (KO), n=14 (black bar). (B) Prepulse inhibition (PPI) to acoustic startle response. The averages (±SEM) for levels (%) of PPI of the startle response in WT (black dotted line) and KO (black solid line).

