Figure 1.

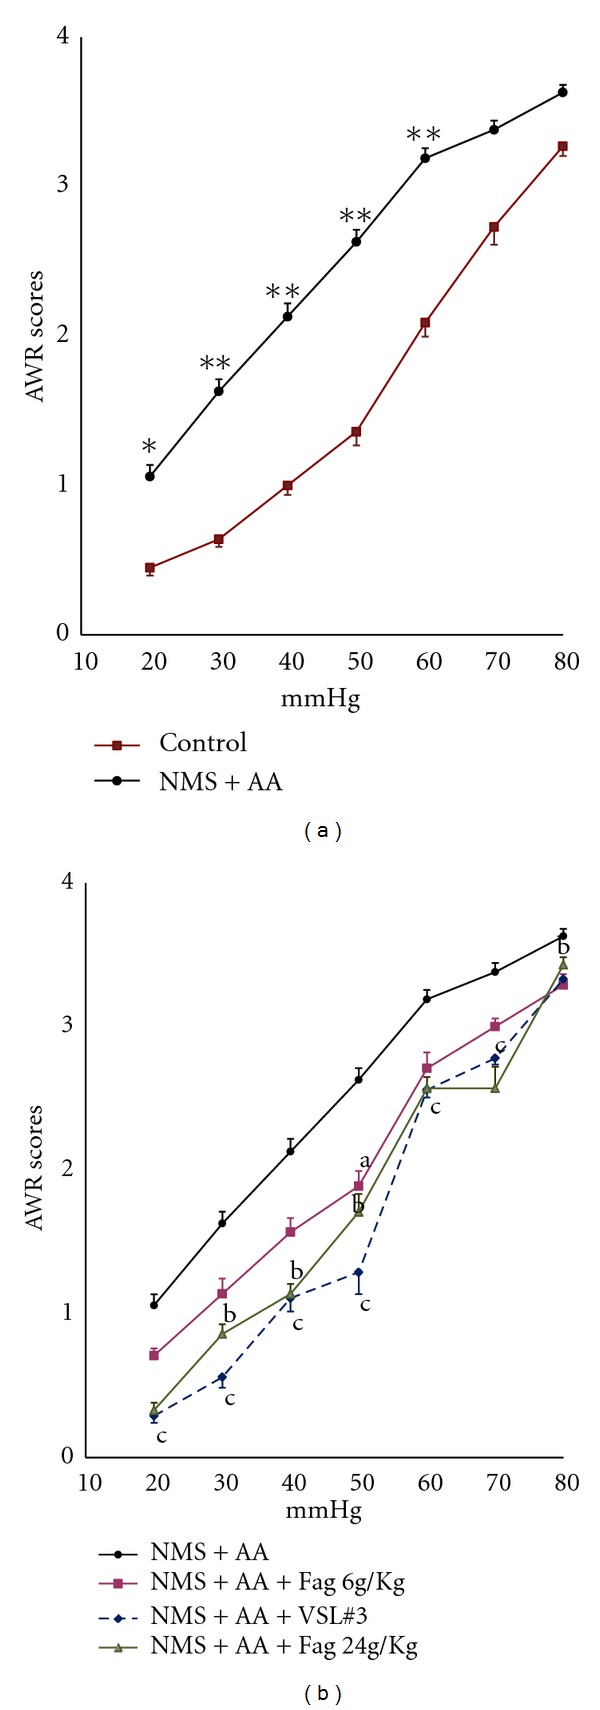
Sensitivities of the rats to CRD. (a) AWR scores of the rats in response to graded CRD. *P < 0.05, **P < 0.01, NMS + AA rats (model group) versus controls. (b) AWR scores of NMS + AA rats treated with Fag (6 g/kg, 24 g/kg) and VLS#3 a P < 0.05, Fag (6 g/kg) treated rats versus NMS + AA rats; b P < 0.05, Fag (24 g/kg) treated rats versus NMS + AA rats; c P < 0.05, VLS#3 treated rats versus NMS + AA rats. The data are expressed as mean ± SEM (n = 8–10 in each group).
