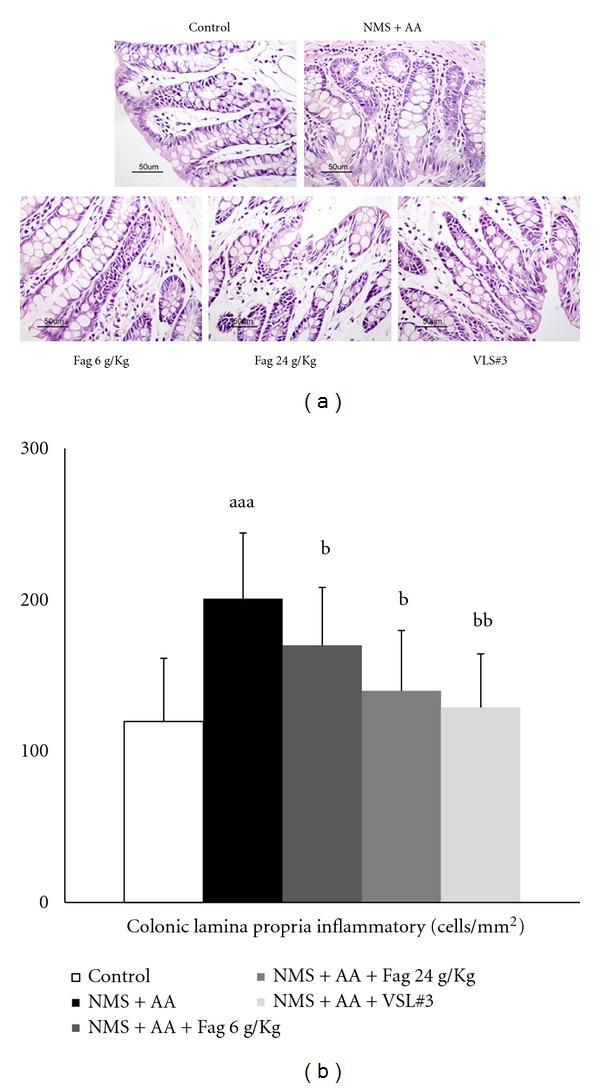
Figure 3.

Effects of Fag treatment on colonic lamina propria inflammatory cells of rats (×200). (a) HE staining of colonic lamina propria inflammatory cells; (b) quantification of inflammatory cells. The data are expressed as cell counts per square millimeter of colon lamina propria. The values are expressed as mean ± SD (n = 8), aa P < 0.01 compared with control rats. b P < 0.05, bb P < 0.01, compared with NMS + AA rats.
