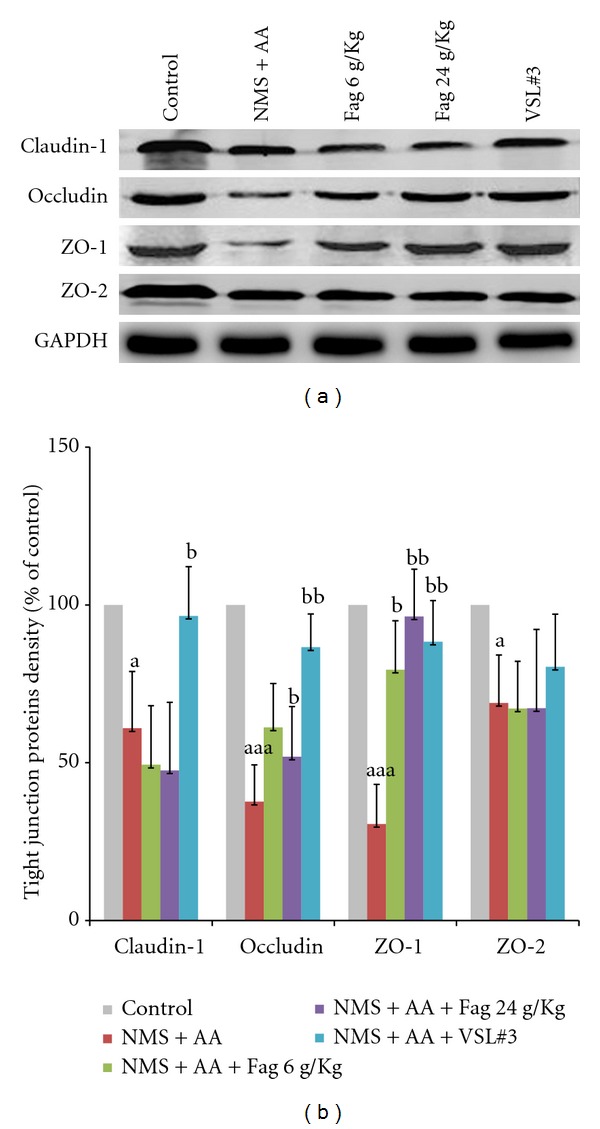
Figure 4.

Western blot of Fag treated rat colon TJs. (a) Protein of claudin-1, occludin, ZO-1, ZO-2. (b) Relative density analysis of concentration-dependent TJs of drug-treated groups and the controls. The values are expressed as mean ± SD (n = 3). a P < 0.05, aaa P < 0.001, compared with control rats; b P < 0.05, bb P < 0.01 compared with NMS + AA rats.
