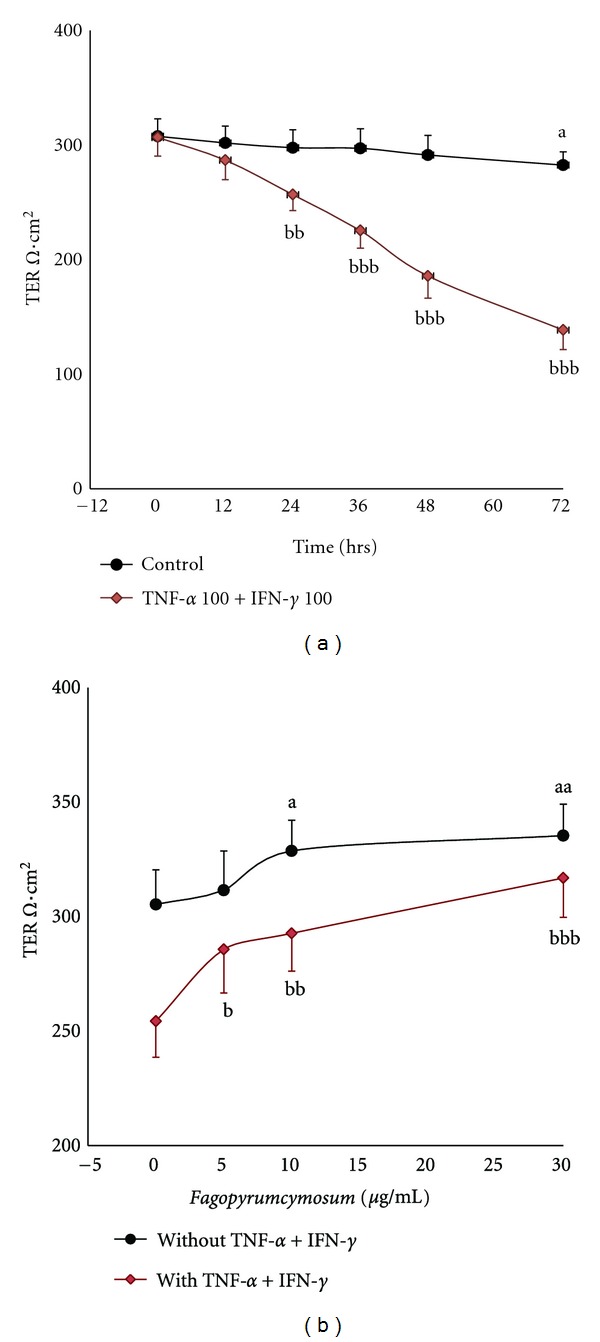
Figure 6.

TER of Caco-2 cell monolayers (Ω·cm2). (a) Effects of treatment time of cytokines: measured at 0, 12, 24, 36, 48, and 72 h after incubating the cells with or without cytokines (100 ng/mL TNF-α and 100 ng/mL IFN-γ). All data are expressed as mean ± SD, n = 6. a P < 0.05, controls without cytokines: 72 h versus 0 h; bbb P < 0.001, at the same time: cells with cytokines versus controls without cytokines. (b) Effects of drug concentration gradient: measured after administrating the cells with Fag (0, 5, 10, or 30 μg/mL) plus cytokines or removing cytokines during the last 24 h. The values are expressed as mean ± SD, n = 6. a P < 0.05, aa P < 0.01, “a” represents 10 and 30 μg/mL Fag versus 0 μg/mL Fag without cytokines, b P < 0.05, bb P < 0.01, bbb P < 0.001, “b” represents 5, 10, and 30 μg/mL Fag versus 0 μg/mL Fag with cytokines.
