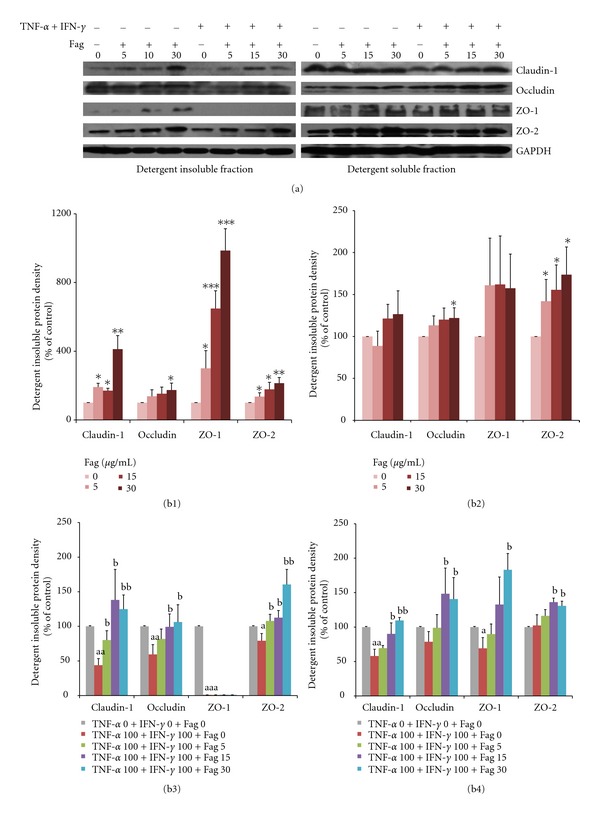
Figure 7.

Immunoblot of TJs (claudin-1, occludin, ZO-1, ZO-2) in Caco-2 cells. (a): TJs of ZO-1, ZO-2, occludin, claudin-1 in the NP40-insoluble and soluble fractions of cells incubated with 0, 15, or 30 μg/mL Fag without cytokines or with cytokines (100 ng/mL TNF-α and 100 ng/mL IFN-γ) for 24 h. (b): Relative grey values (% of the controls) of TJs. (b1)-(b3) Detergent insoluble; (b2)-(b4) detergent soluble; (b1) and (b2) were incubated with or without Fag; (b3) and (b4) were incubated with or without Fag and cytokines (100 ng/mL TNF-α and 100 ng/mL IFN-γ). The density values are normalized to those of the corresponding controls. The values are expressed as mean ± SD (n = 3). *P < 0.05, **P < 0.01, ***P < 0.001, the symbols indicate the differences from the controls (Fag = 0); a P < 0.05, aa P < 0.01, aaa P < 0.001, b P < 0.05, bb P < 0.01, “a” represents TJs in the cells incubated with only cytokines versus controls (TNF-α 0 + IFN-γ 0 + Fag 0); “b” represents TJs in the cells incubated with Fag and cytokines versus those incubated with cytokines alone.
