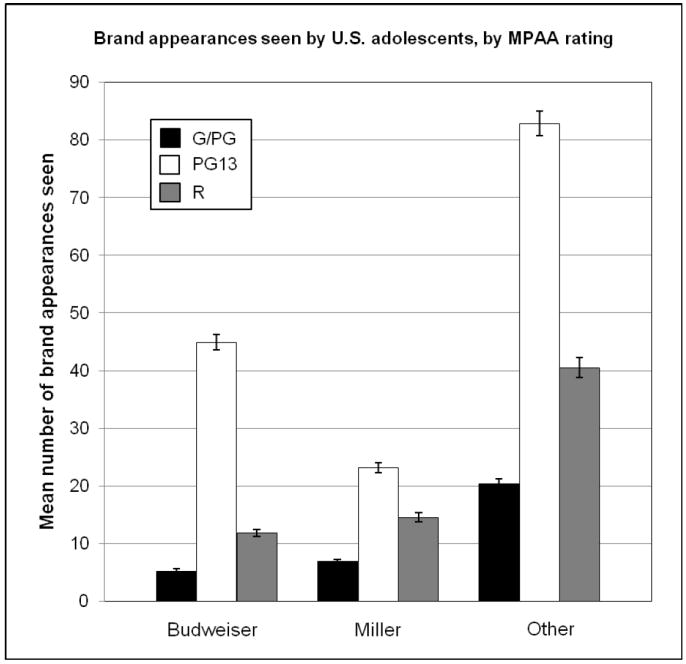
Figure 3.

Mean number of brand appearances seen by U.S. adolescents.
Note: Estimated number of exposures per child for the most common brands identified in the movie sample. “Other” includes 134 other brands of beer and liquor. Error bars represent the 95% confidence interval around the mean.
