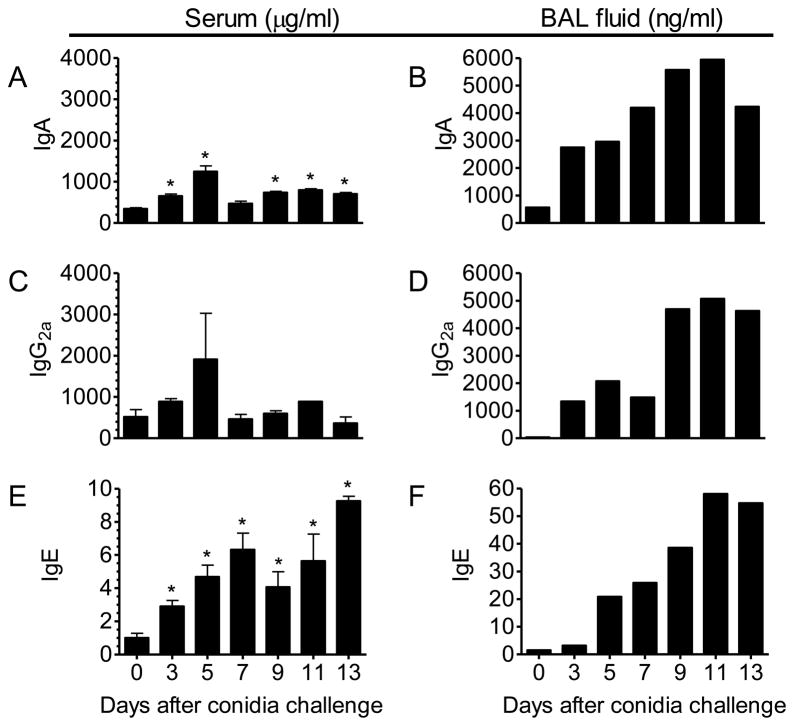
Figure 2. Effect of the inhalation of A. fumigatus on the production of IgA, IgG2a, and IgE isotypes in the serum and BAL fluid of BALB/c mice.
Mice were sensitized and exposed to A. fumigatus according to the schedule shown in figure 1. Ab isotypes were quantified by specific ELISA in serum and BAL fluid at days 3, 5, 7, 9, 11, and 13 and compared to sensitized mice that were not challenged with inhaled fungal conidia. The resulting data was analyzed using an unpaired, student’s two tailed t test with Welch’s correction. All values are expressed as the mean ±S.E.M. n = 4–5 mice/group, * p < 0.05 was considered statistically significant.

