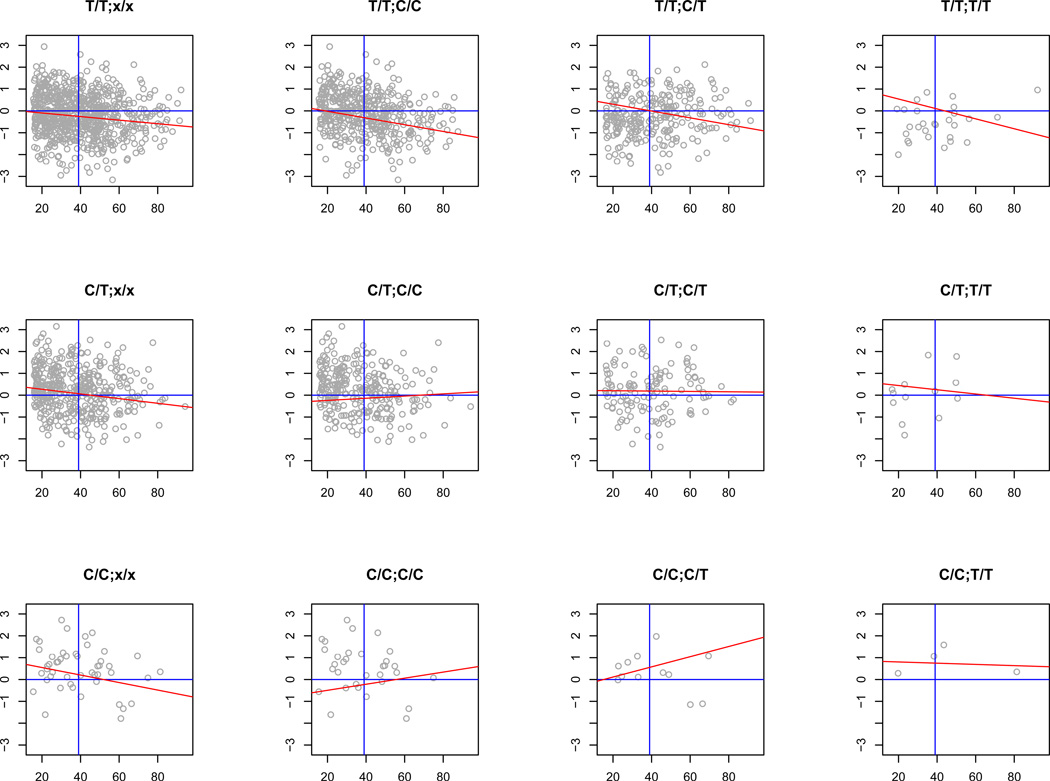
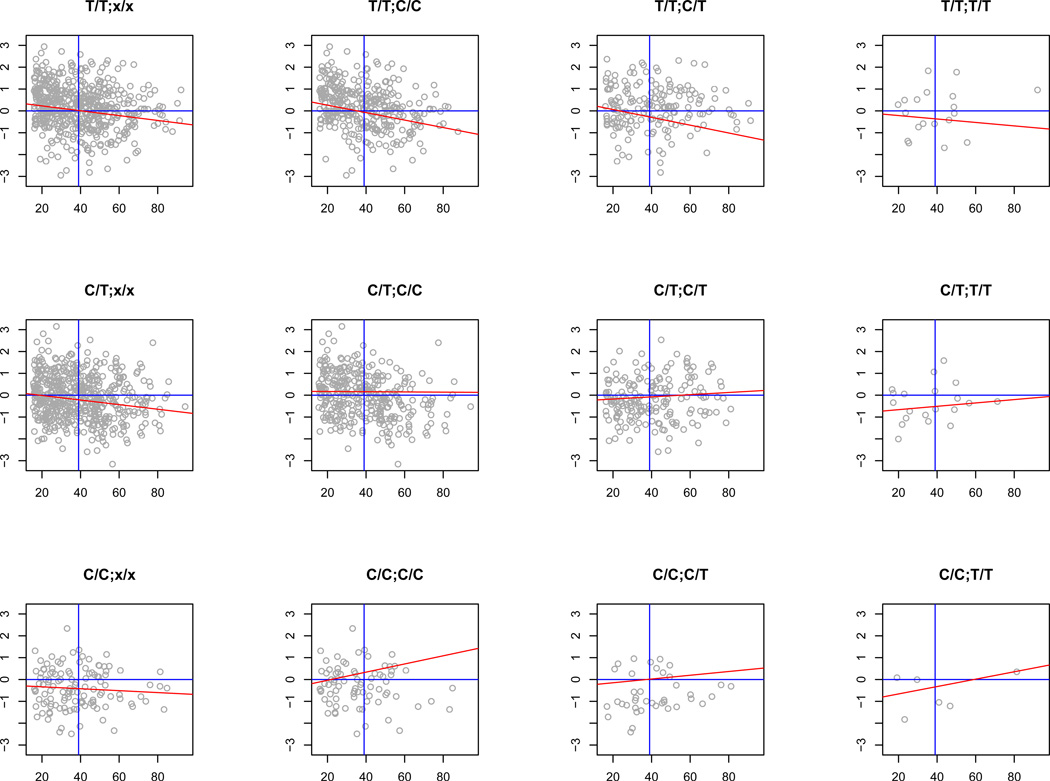
Figure 4. Norms of reaction for cis- and trans-regulatory variants.
Genotype-specific regressions of UBQLNL mRNA levels on age. Panel A, cis-SNP = rs7939159; Panel B, cis-SNP = rs7129909; trans-SNP = rs11591635 in each case. Plot labels = cis-/trans genotype. Left column: norms of reaction for cis-acting SNP genotypes without stratification by trans-interacting genotype show an overall reduction of expression level with age (red lines reflect maximum-likelihood estimates of regression slope and intercept at cohort mean age). Remaining columns: cis-genotypes stratified by trans-genotype reveal patterns of cis-trans G×AI (see text). Grey axes represent mean values for UBQLNL expression (vertical axis, horizontal line) and age (horizontal axis, vertical line).


