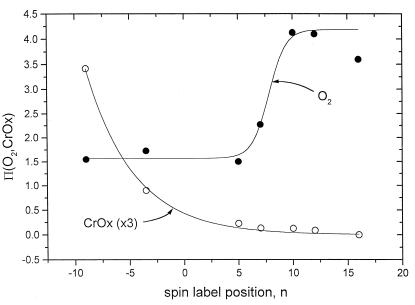
Figure 2.
Permeation profiles, Π, for oxygen (O2, ●) and chromium oxalate (CrOx, ○) deduced from spin-lattice relaxation enhancements of n-PCSL spin labels in rod outer segment disk membranes (data from ref. 26). For CrOx, the values are scaled by a factor of 3. Solid line for O2 represents a nonlinear least squares fit with an expression equivalent to Eq. 2. Fitting parameters are: no = 7.8 ± 0.2, with the decay constant fixed at λ = 0.78. Solid line for CrOx is a simple exponential decay, starting at n = −9 with a decay constant λ = 4.35 ± 0.24. The spin labels positioned at n = −3.5 and n = −9 represent N-TEMPO-stearamide and N-TEMPO-phosphatidylcholine (TEMPO is 2,2,6,6-tetramethylpiperidine-N-oxyl) , respectively, with the nitroxide in the polar headgroup region of the lipid molecule.

