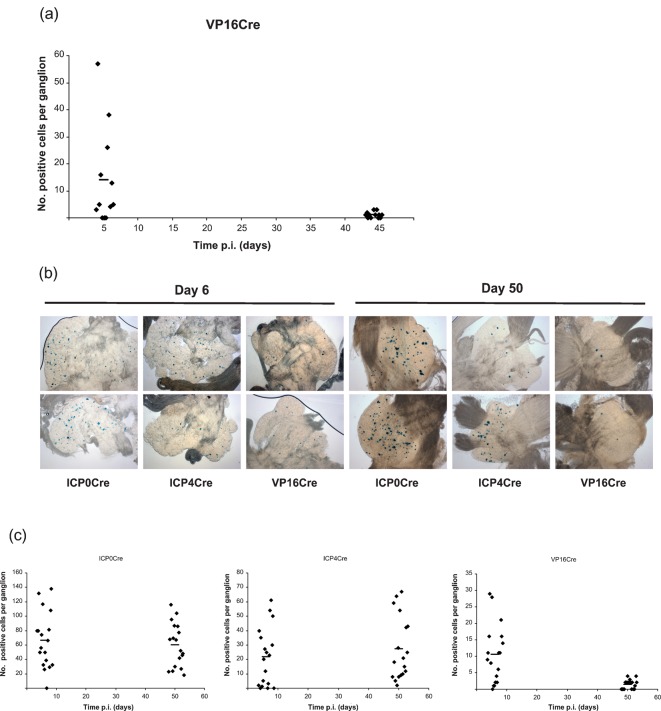
Fig. 3.
In vivo reporter gene expression activated by HSVVP16Cre. (a) Number of positive cells per ganglion detected at the specified time points p.i. of R26R mice with HSVVP16Cre. (b) Light micrographs of X-Gal stained DRG from R26R mice infected with HSVICP0Cre, HSVICP4Cre and HSVVP16Cre at days 6 and 50 p.i. (c) Number of positive cells per ganglion detected following infection of R26R mice with HSVICP0Cre, HSVICP4Cre and HSVVP16Cre at days 6 and 50 p.i. Each symbol represents a ganglion and the bar represents the mean at the given time point.

