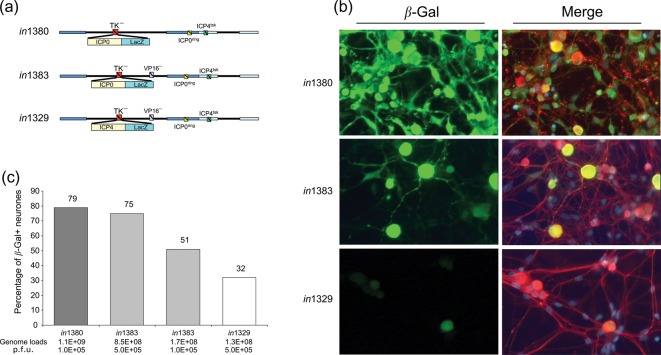
Fig. 5.
Activation of the ICP0 and ICP4Ps in primary neuronal cultures. (a) Genomic structures of in1380, in1383 and in1329. (b) Representative immunofluorescent images of neuronal cultures infected with 105 p.f.u. of in1380 and in1383 and 5×10⁵ p.f.u. of in1329. Cultures were fixed 2 days p.i. and immunostained for expression of β-Gal (FITC, green) and neurone-specific β-tubulin III (Cy3, red) and counterstained with DAPI to show cell nuclei (blue). The merged images show co-visualization of FITC, Cy3 and DAPI fluorescence in which co-localization of β-Gal and β-tubulin III gives a yellow–orange signal. (c) Summary histogram showing the percentage of β-Gal-positive neurones detected 2 days following infection with in1380, in1383 and in1329. The infection dose in terms of p.f.u. or genome load per well is indicated.

