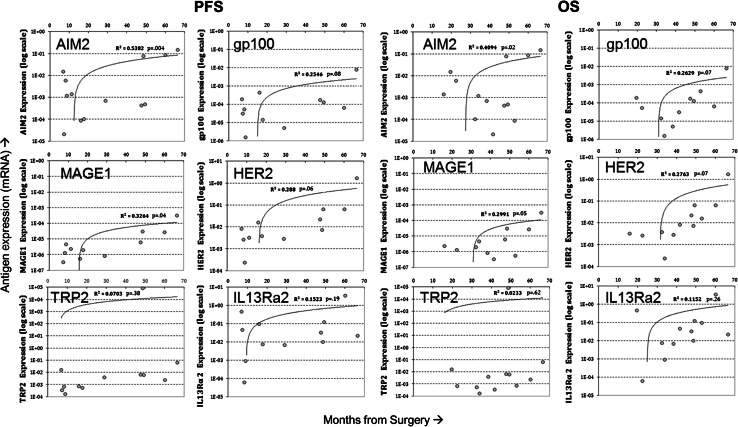
Fig. 2.
a Correlation of quantitative antigen expression on primary tumor from ND patients with progression-free survival (n = 13). Logarithmic plots of antigen expression determined by qRT-PCR (see “Patients and methods”) showed correlations of increasing antigen expression with longer progression-free survival times (PFS). Antigen expression was measured from fresh-frozen samples and calculated relative to GAPDH. b Correlation of quantitative antigen expression on primary tumor from ND patients with overall survival (n = 13). Logarithmic plots of antigen expression determined by qRTPCR (see “Patients and methods”) showed correlations of increasing antigen expression with longer overall survival time (OS)

