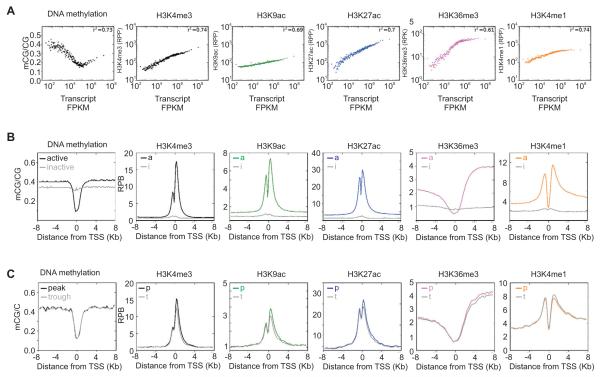
Figure 2. Temporal changes in histone modifications at oscillating loci are distinct from differences in histone modification signatures at expressed and silent loci.
(A) Scatter plot of transcript levels (x-axis) and the indicated epigenomic feature (y-axis). RNA, histone modification and DNA methylation at promoter or gene body regions of 14,492 expressed genes were grouped in bins of 100 and median normalized. H3K4me3, H3K4me1, H3K9ac and H3K27ac are shown as reads per promoters (RPP) while H3K36me3 is shown as reads per kilobase of gene body (RPK). DNA methylation is shown as the ratio of methylated CG to total CG in the promoters (±4 kb). (B) Average enrichment patterns of histone modifications and the extent of DNA methylation is shown in the promoter areas of active vs. inactive genes. The y-axis shows the extent of enrichment in reads per 150 bp bins (RPB). (C) Average DNA methylation and histone modifications in the promoters of ~700 oscillating genes at either peak (p) or trough (t) of transcript levels.

