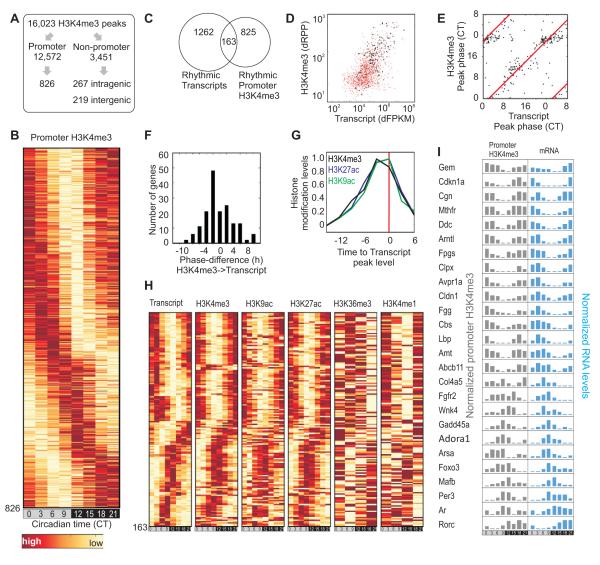
Figure 3. Oscillating H3K4me3 identified highly dynamic histone modifications at promoters.
(A) Schematics for identification of oscillating H3K4me3 peaks. (B) Heatmap rendering of oscillating promoter H3K4me3 levels at 826 loci. (C) Venn diagram of overlap between oscillating transcripts and oscillating H3K4me3 at their promoters. (D) The absolute changes of transcript (dFPKM) and H3K4me3 (dRPP) levels of 1,262 oscillating genes are shown in a scatter plot in red. 163 loci with oscillating H3K4me3 levels are shown in black. (E) Scatter plot of the peak phase of transcript (x-axis) and H3K4me3 (y-axis) at 163 oscillating transcript-H3K4me3 pairs. (F) Difference in peak phase between transcript and H3K4me3 levels. (G) Histone modification levels in 163 oscillating loci are normalized relative to transcript peak time. (H) Heat map representation of the levels of transcript, H3K4me3, H3K9ac, H3K27ac H3K36me3 (gene body) and H3K4me1 levels in 163 oscillating transcript-promoter H3K4me3 pairs. (I) Examples of temporally correlated oscillating promoter H3K4me3 levels and transcript. Gene symbols, normalized histone modification levels and transcript levels are shown.

